注意
跳转到末尾下载完整的示例代码。
程序化控制子图调整#
注意
本示例主要旨在展示 Matplotlib 中的一些高级概念。
如果您只是想为标签留出足够的空间,通常更简单且足够好的方法是手动设置子图参数,使用 Figure.subplots_adjust,或者使用其中一种自动布局机制(约束布局指南 或 紧凑布局指南)。
本示例描述了一种用户自定义的方法,用于读取 Artist 大小并相应地设置子图参数。其主要目的是阐明一些高级概念,例如读取文本位置、使用边界框和变换,以及使用 事件。但如果您想自动化布局并需要比紧凑布局和约束布局更大的灵活性,它也可以作为起点。
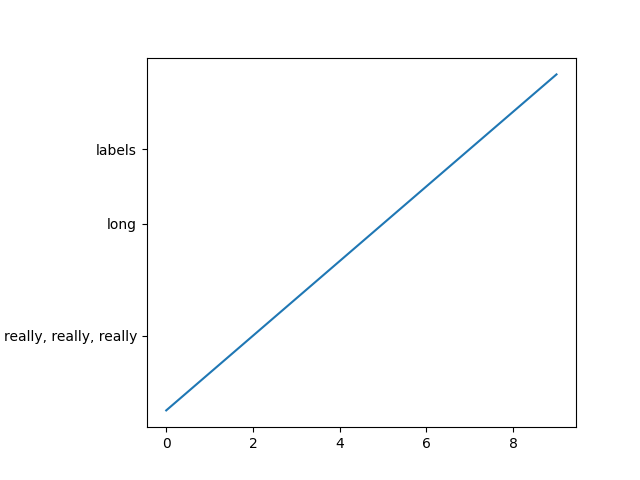
下面,我们收集所有 y 轴标签的边界框,并将子图的左边界向右移动,以便为所有边界框的并集留出足够的空间。
计算文本边界框有一个注意事项:查询文本边界框(Text.get_window_extent)需要一个渲染器(RendererBase 实例)来计算文本大小。此渲染器仅在图形绘制后才可用(Figure.draw)。
一个解决方案是将调整逻辑放入绘图回调中。此函数在图形绘制后执行。它现在可以检查子图是否为文本留出了足够的空间。如果不够,则更新子图参数并触发第二次绘图。
import matplotlib.pyplot as plt

import matplotlib.transforms as mtransforms

fig, ax = plt.subplots()
ax.plot(range(10))
ax.set_yticks([2, 5, 7], labels=['really, really, really', 'long', 'labels'])


def on_draw(event):
    bboxes = []
    for label in ax.get_yticklabels():
        # Bounding box in pixels
        bbox_px = label.get_window_extent()
        # Transform to relative figure coordinates. This is the inverse of
        # transFigure.
        bbox_fig = bbox_px.transformed(fig.transFigure.inverted())
        bboxes.append(bbox_fig)
    # the bbox that bounds all the bboxes, again in relative figure coords
    bbox = mtransforms.Bbox.union(bboxes)
    if fig.subplotpars.left < bbox.width:
        # Move the subplot left edge more to the right
        fig.subplots_adjust(left=1.1*bbox.width)  # pad a little
        fig.canvas.draw()


fig.canvas.mpl_connect('draw_event', on_draw)

plt.show()
参考
本示例展示了以下函数、方法、类和模块的使用