注意
跳转到底部下载完整的示例代码。
使用 ConciseDateFormatter 格式化日期刻度#
为包含日期数据的坐标轴找到合适的刻度值并格式化刻度通常是一个挑战。ConciseDateFormatter 旨在改进为刻度标签选择的字符串,并尽可能地减少这些刻度标签中使用的字符串。
注意
此格式化器有望在未来版本的 Matplotlib 中成为默认的日期刻度格式化器。请向 GitHub 仓库或邮件列表报告任何问题或改进建议。
import datetime

import matplotlib.pyplot as plt
import numpy as np

import matplotlib.dates as mdates
首先,是默认的格式化器。
base = datetime.datetime(2005, 2, 1)
dates = [base + datetime.timedelta(hours=(2 * i)) for i in range(732)]
N = len(dates)
np.random.seed(19680801)
y = np.cumsum(np.random.randn(N))

fig, axs = plt.subplots(3, 1, layout='constrained', figsize=(6, 6))
lims = [(np.datetime64('2005-02'), np.datetime64('2005-04')),
        (np.datetime64('2005-02-03'), np.datetime64('2005-02-15')),
        (np.datetime64('2005-02-03 11:00'), np.datetime64('2005-02-04 13:20'))]
for nn, ax in enumerate(axs):
    ax.plot(dates, y)
    ax.set_xlim(lims[nn])
    # rotate_labels...
    for label in ax.get_xticklabels():
        label.set_rotation(40)
        label.set_horizontalalignment('right')
axs[0].set_title('Default Date Formatter')
plt.show()
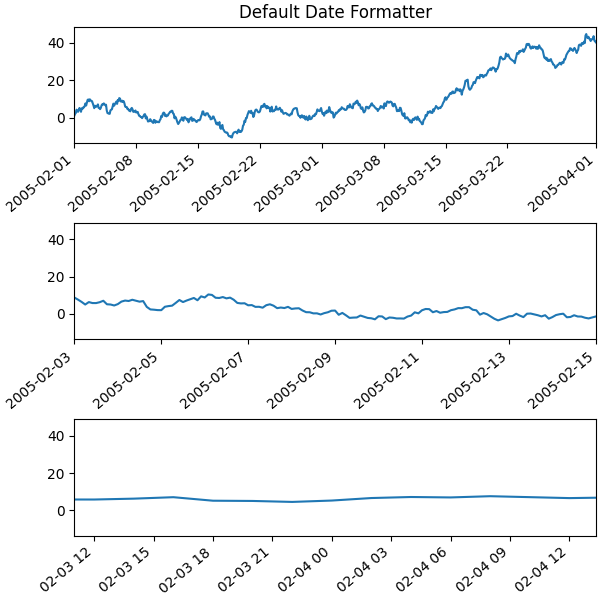
默认的日期格式化器非常冗长,因此我们可以选择使用 ConciseDateFormatter,如下所示。请注意,对于此示例,标签无需像默认格式化器那样旋转,因为标签已尽可能小。
fig, axs = plt.subplots(3, 1, layout='constrained', figsize=(6, 6))
for nn, ax in enumerate(axs):
    locator = mdates.AutoDateLocator(minticks=3, maxticks=7)
    formatter = mdates.ConciseDateFormatter(locator)
    ax.xaxis.set_major_locator(locator)
    ax.xaxis.set_major_formatter(formatter)

    ax.plot(dates, y)
    ax.set_xlim(lims[nn])
axs[0].set_title('Concise Date Formatter')

plt.show()
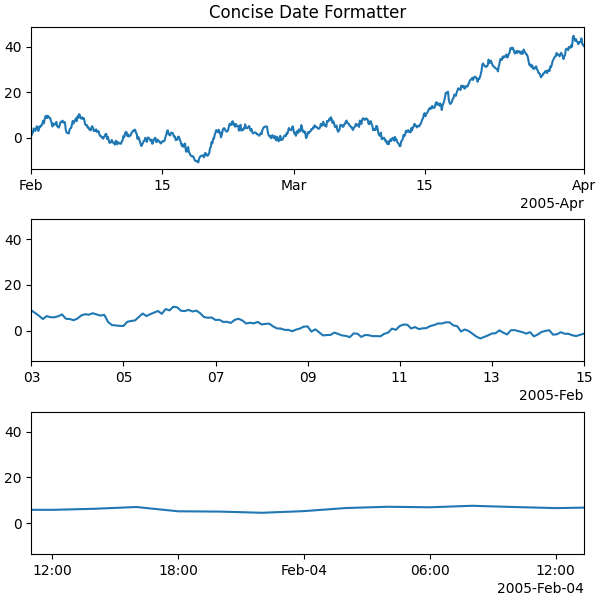
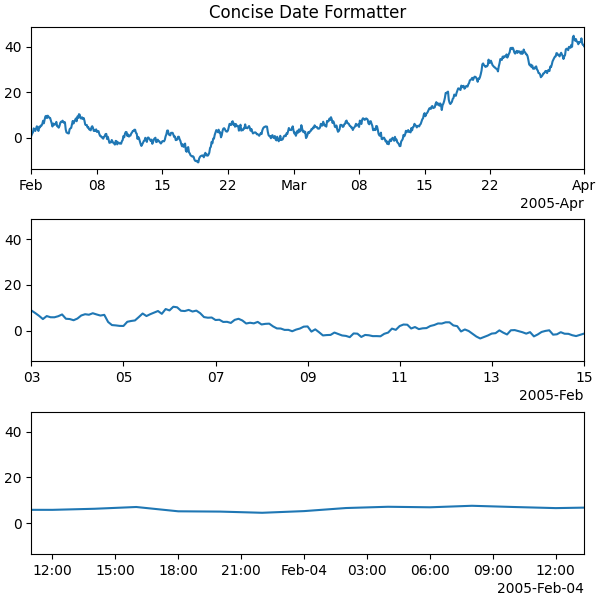
如果所有对包含日期的坐标轴的调用都使用此转换器,那么在进行导入时使用单位注册表可能最方便
import matplotlib.units as munits

converter = mdates.ConciseDateConverter()
munits.registry[np.datetime64] = converter
munits.registry[datetime.date] = converter
munits.registry[datetime.datetime] = converter

fig, axs = plt.subplots(3, 1, figsize=(6, 6), layout='constrained')
for nn, ax in enumerate(axs):
    ax.plot(dates, y)
    ax.set_xlim(lims[nn])
axs[0].set_title('Concise Date Formatter')

plt.show()
日期格式的本地化#
如果默认格式不合意,可以通过操作三个字符串列表之一来本地化日期格式。
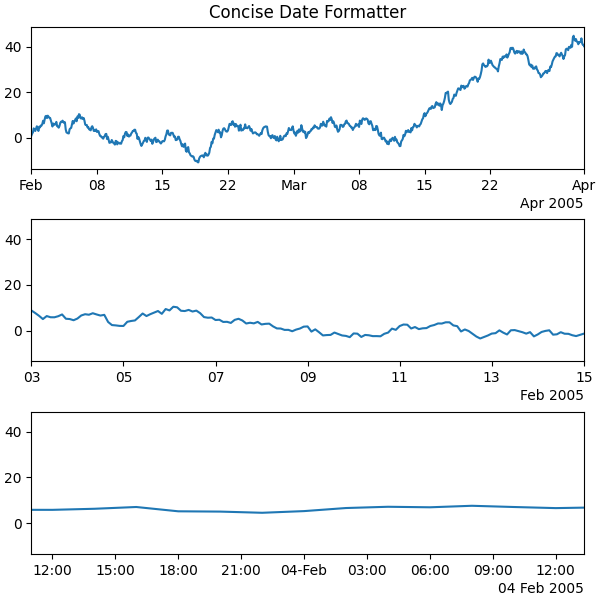
formatter.formats 格式列表用于正常的刻度标签,共有六个级别:年、月、日、小时、分钟、秒。formatter.offset_formats 用于格式化坐标轴右侧的“偏移”字符串。这通常比刻度标签更冗长。最后,formatter.zero_formats 是“零点”刻度的格式。这些刻度值要么是每年、每月或每月的第一天,要么是零时、零分或零秒。这些通常与上一级别的刻度格式相同。例如,如果坐标轴限制表示刻度主要是日期,那么我们只需用“Mar”标记 2005 年 3 月 1 日。如果坐标轴限制主要是小时,我们只需用“Feb-4”标记 2 月 4 日 00:00。
请注意,这些格式列表也可以作为可选关键字参数传递给 ConciseDateFormatter。
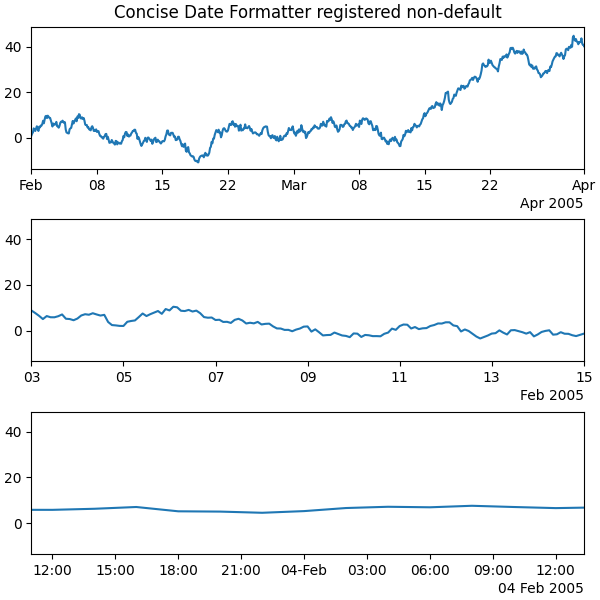
在这里,我们将标签修改为“日 月 年”,而不是 ISO 标准的“年 月 日”
fig, axs = plt.subplots(3, 1, layout='constrained', figsize=(6, 6))

for nn, ax in enumerate(axs):
    locator = mdates.AutoDateLocator()
    formatter = mdates.ConciseDateFormatter(locator)
    formatter.formats = ['%y',  # ticks are mostly years
                         '%b',       # ticks are mostly months
                         '%d',       # ticks are mostly days
                         '%H:%M',    # hrs
                         '%H:%M',    # min
                         '%S.%f', ]  # secs
    # these are mostly just the level above...
    formatter.zero_formats = [''] + formatter.formats[:-1]
    # ...except for ticks that are mostly hours, then it is nice to have
    # month-day:
    formatter.zero_formats[3] = '%d-%b'

    formatter.offset_formats = ['',
                                '%Y',
                                '%b %Y',
                                '%d %b %Y',
                                '%d %b %Y',
                                '%d %b %Y %H:%M', ]
    ax.xaxis.set_major_locator(locator)
    ax.xaxis.set_major_formatter(formatter)

    ax.plot(dates, y)
    ax.set_xlim(lims[nn])
axs[0].set_title('Concise Date Formatter')

plt.show()
注册一个带本地化的转换器#
ConciseDateFormatter 没有 rcParams 条目,但可以通过向 ConciseDateConverter 传递关键字参数,并将您将使用的数据类型注册到单位注册表来完成本地化。
import datetime

formats = ['%y',          # ticks are mostly years
           '%b',     # ticks are mostly months
           '%d',     # ticks are mostly days
           '%H:%M',  # hrs
           '%H:%M',  # min
           '%S.%f', ]  # secs
# these can be the same, except offset by one level....
zero_formats = [''] + formats[:-1]
# ...except for ticks that are mostly hours, then it's nice to have month-day
zero_formats[3] = '%d-%b'
offset_formats = ['',
                  '%Y',
                  '%b %Y',
                  '%d %b %Y',
                  '%d %b %Y',
                  '%d %b %Y %H:%M', ]

converter = mdates.ConciseDateConverter(
    formats=formats, zero_formats=zero_formats, offset_formats=offset_formats)

munits.registry[np.datetime64] = converter
munits.registry[datetime.date] = converter
munits.registry[datetime.datetime] = converter

fig, axs = plt.subplots(3, 1, layout='constrained', figsize=(6, 6))
for nn, ax in enumerate(axs):
    ax.plot(dates, y)
    ax.set_xlim(lims[nn])
axs[0].set_title('Concise Date Formatter registered non-default')

plt.show()
脚本总运行时间:(0 分 5.625 秒)