注意
跳转到末尾 下载完整的示例代码。
饼图的条形图#
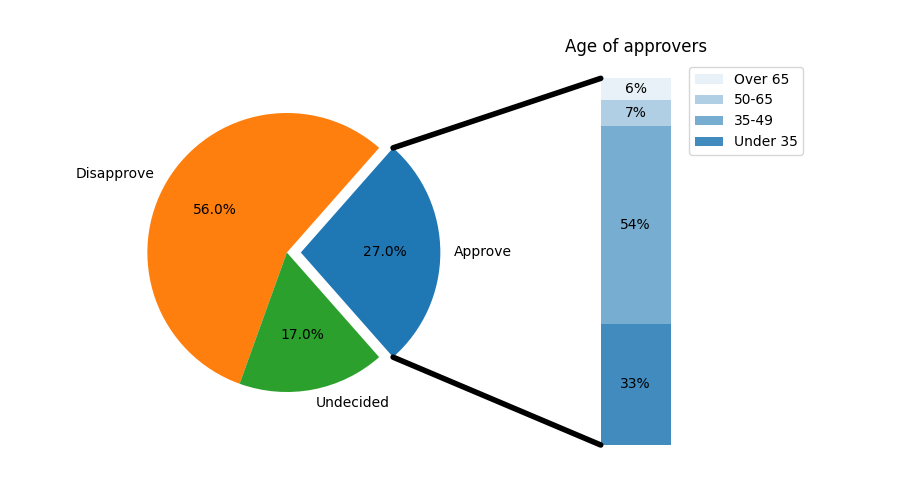
创建一个“饼图的条形图”,其中饼图的第一部分被“突出显示”为一个条形图,并进一步细分了该部分的特征。本示例演示了如何使用包含多组坐标轴的图,以及如何使用坐标轴的补丁列表添加两个 ConnectionPatches 来连接子图。
import matplotlib.pyplot as plt
import numpy as np

from matplotlib.patches import ConnectionPatch

# make figure and assign axis objects
fig, (ax1, ax2) = plt.subplots(1, 2, figsize=(9, 5))
fig.subplots_adjust(wspace=0)

# pie chart parameters
overall_ratios = [.27, .56, .17]
labels = ['Approve', 'Disapprove', 'Undecided']
explode = [0.1, 0, 0]
# rotate so that first wedge is split by the x-axis
angle = -180 * overall_ratios[0]
wedges, *_ = ax1.pie(overall_ratios, autopct='%1.1f%%', startangle=angle,
                     labels=labels, explode=explode)

# bar chart parameters
age_ratios = [.33, .54, .07, .06]
age_labels = ['Under 35', '35-49', '50-65', 'Over 65']
bottom = 1
width = .2

# Adding from the top matches the legend.
for j, (height, label) in enumerate(reversed([*zip(age_ratios, age_labels)])):
    bottom -= height
    bc = ax2.bar(0, height, width, bottom=bottom, color='C0', label=label,
                 alpha=0.1 + 0.25 * j)
    ax2.bar_label(bc, labels=[f"{height:.0%}"], label_type='center')

ax2.set_title('Age of approvers')
ax2.legend()
ax2.axis('off')
ax2.set_xlim(- 2.5 * width, 2.5 * width)

# use ConnectionPatch to draw lines between the two plots
theta1, theta2 = wedges[0].theta1, wedges[0].theta2
center, r = wedges[0].center, wedges[0].r
bar_height = sum(age_ratios)

# draw top connecting line
x = r * np.cos(np.pi / 180 * theta2) + center[0]
y = r * np.sin(np.pi / 180 * theta2) + center[1]
con = ConnectionPatch(xyA=(-width / 2, bar_height), coordsA=ax2.transData,
                      xyB=(x, y), coordsB=ax1.transData)
con.set_color([0, 0, 0])
con.set_linewidth(4)
ax2.add_artist(con)

# draw bottom connecting line
x = r * np.cos(np.pi / 180 * theta1) + center[0]
y = r * np.sin(np.pi / 180 * theta1) + center[1]
con = ConnectionPatch(xyA=(-width / 2, 0), coordsA=ax2.transData,
                      xyB=(x, y), coordsB=ax1.transData)
con.set_color([0, 0, 0])
ax2.add_artist(con)
con.set_linewidth(4)

plt.show()

参考
本示例展示了以下函数、方法、类和模块的使用