注意
转到末尾以下载完整示例代码。
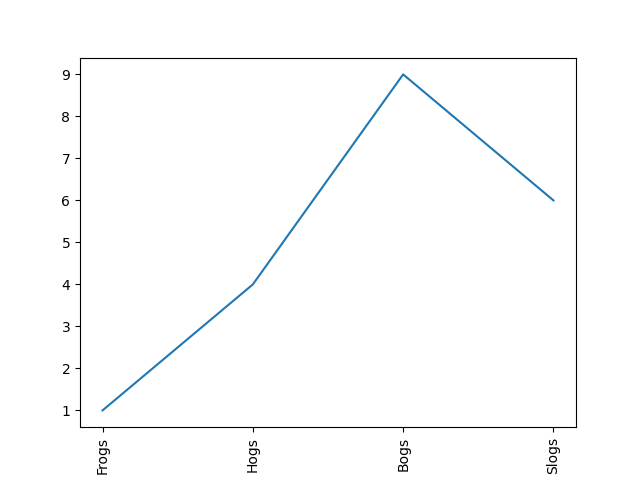
旋转刻度标签#
import matplotlib.pyplot as plt

x = [1, 2, 3, 4]
y = [1, 4, 9, 6]
labels = ['Frogs', 'Hogs', 'Bogs', 'Slogs']

fig, ax = plt.subplots()
ax.plot(x, y)
# A tick label rotation can be set using Axes.tick_params.
ax.tick_params("y", rotation=45)
# Alternatively, if setting custom labels with set_xticks/set_yticks, it can
# be set at the same time as the labels.
# For both APIs, the rotation can be an angle in degrees, or one of the strings
# "horizontal" or "vertical".
ax.set_xticks(x, labels, rotation='vertical')

plt.show()

参考
本示例展示了以下函数、方法、类和模块的使用