注意
跳转到末尾下载完整示例代码。
使用 plt.subplots 创建多个子图#
pyplot.subplots 通过一次调用创建图和子图网格,同时对单个图的创建方式提供了合理的控制。对于更高级的用例,您可以使用 GridSpec 实现更通用的子图布局,或使用 Figure.add_subplot 在图中任意位置添加子图。
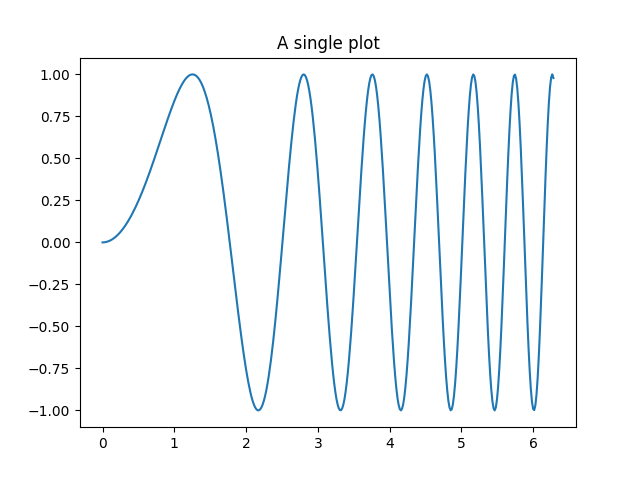
只有一个子图的图#
不带参数的 subplots() 返回一个 Figure 和一个单独的 Axes。
这实际上是创建单个图和 Axes 的最简单且推荐的方法。
fig, ax = plt.subplots()
ax.plot(x, y)
ax.set_title('A single plot')
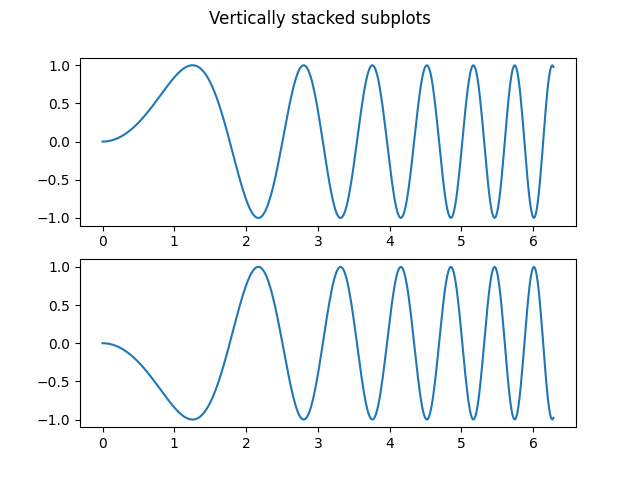
在一个方向上堆叠子图#
pyplot.subplots 的前两个可选参数定义了子图网格的行数和列数。
当仅在一个方向上堆叠时,返回的 axs 是一个包含已创建的 Axes 列表的一维 numpy 数组。
fig, axs = plt.subplots(2)
fig.suptitle('Vertically stacked subplots')
axs[0].plot(x, y)
axs[1].plot(x, -y)

如果您只创建少量 Axes,可以很方便地立即将它们解包到每个 Axes 的专用变量中。这样,我们就可以使用 ax1 而不是更冗长的 axs[0]。
fig, (ax1, ax2) = plt.subplots(2)
fig.suptitle('Vertically stacked subplots')
ax1.plot(x, y)
ax2.plot(x, -y)
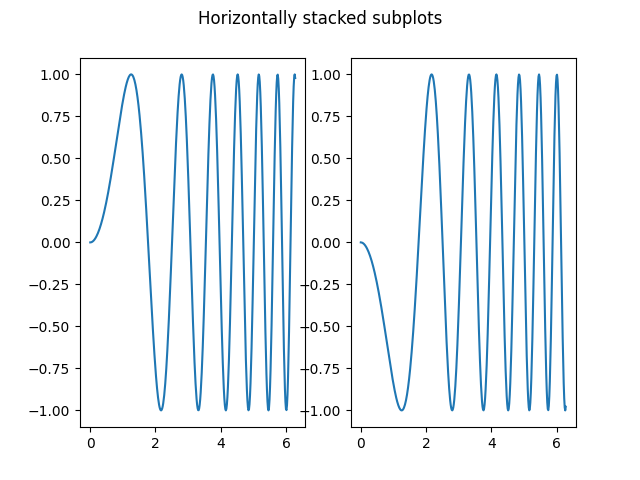
要获得并排的子图,请传递参数 1, 2 以创建一个一行两列的布局。
fig, (ax1, ax2) = plt.subplots(1, 2)
fig.suptitle('Horizontally stacked subplots')
ax1.plot(x, y)
ax2.plot(x, -y)
在两个方向上堆叠子图#
当在两个方向上堆叠时,返回的 axs 是一个二维 NumPy 数组。
如果您需要为每个子图设置参数,可以方便地使用 for ax in axs.flat: 遍历二维网格中的所有子图。
fig, axs = plt.subplots(2, 2)
axs[0, 0].plot(x, y)
axs[0, 0].set_title('Axis [0, 0]')
axs[0, 1].plot(x, y, 'tab:orange')
axs[0, 1].set_title('Axis [0, 1]')
axs[1, 0].plot(x, -y, 'tab:green')
axs[1, 0].set_title('Axis [1, 0]')
axs[1, 1].plot(x, -y, 'tab:red')
axs[1, 1].set_title('Axis [1, 1]')

for ax in axs.flat:
    ax.set(xlabel='x-label', ylabel='y-label')

# Hide x labels and tick labels for top plots and y ticks for right plots.
for ax in axs.flat:
    ax.label_outer()
![Axis [0, 0], Axis [0, 1], Axis [1, 0], Axis [1, 1]](../../_images/sphx_glr_subplots_demo_005.png)
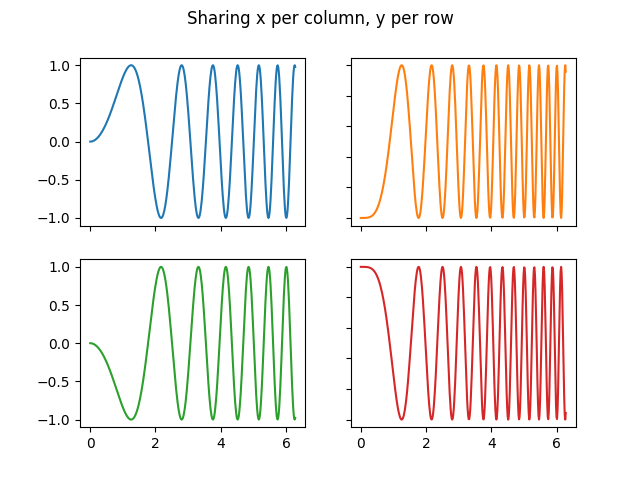
您也可以在二维中使用元组解包,将所有子图分配给专用变量
fig, ((ax1, ax2), (ax3, ax4)) = plt.subplots(2, 2)
fig.suptitle('Sharing x per column, y per row')
ax1.plot(x, y)
ax2.plot(x, y**2, 'tab:orange')
ax3.plot(x, -y, 'tab:green')
ax4.plot(x, -y**2, 'tab:red')

for ax in fig.get_axes():
    ax.label_outer()
共享坐标轴#
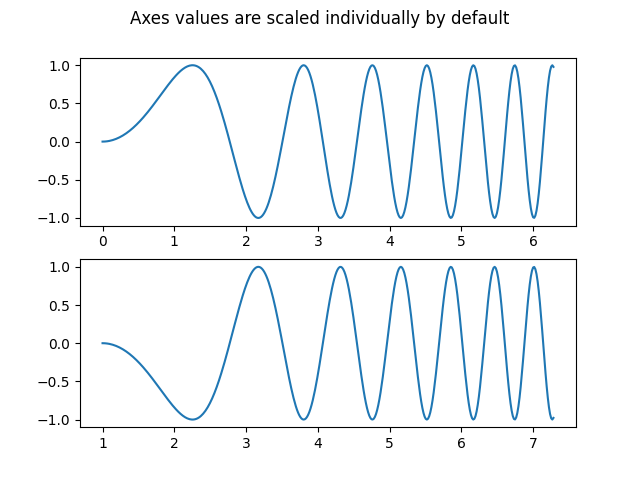
默认情况下,每个 Axes 都是独立缩放的。因此,如果范围不同,子图的刻度值将不对齐。
fig, (ax1, ax2) = plt.subplots(2)
fig.suptitle('Axes values are scaled individually by default')
ax1.plot(x, y)
ax2.plot(x + 1, -y)
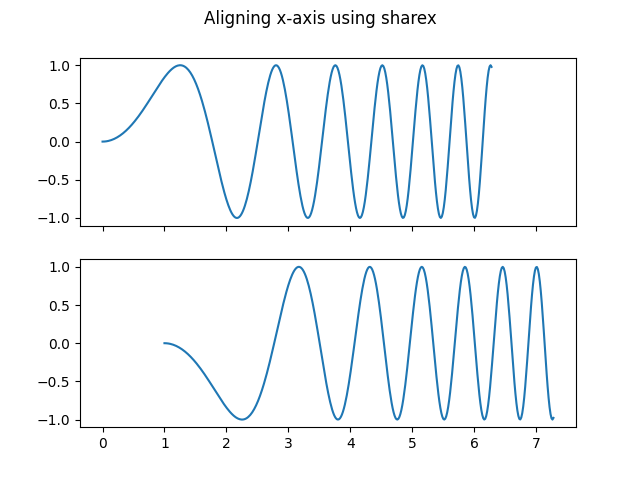
您可以使用 sharex 或 sharey 对齐水平或垂直坐标轴。
fig, (ax1, ax2) = plt.subplots(2, sharex=True)
fig.suptitle('Aligning x-axis using sharex')
ax1.plot(x, y)
ax2.plot(x + 1, -y)
将 sharex 或 sharey 设置为 True 将在整个网格中启用全局共享,即当使用 sharey=True 时,垂直堆叠子图的 y 轴也具有相同的刻度。
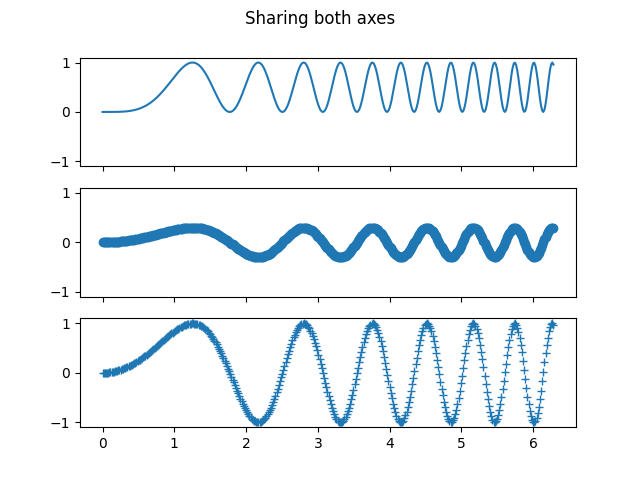
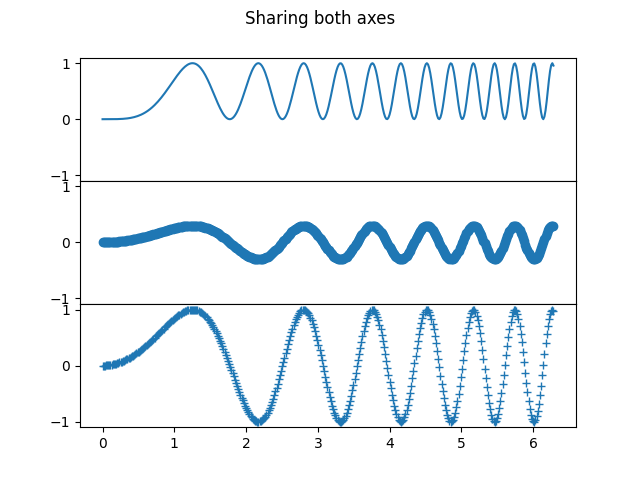
对于共享坐标轴的子图,一组刻度标签就足够了。内部 Axes 的刻度标签会被 sharex 和 sharey 自动移除。子图之间仍然存在未使用的空白区域。
为了精确控制子图的位置,可以显式使用 Figure.add_gridspec 创建一个 GridSpec,然后调用其 subplots 方法。例如,我们可以使用 add_gridspec(hspace=0) 减少垂直子图之间的高度。
label_outer 是一个方便的方法,可以移除网格边缘之外的子图的标签和刻度。
fig = plt.figure()
gs = fig.add_gridspec(3, hspace=0)
axs = gs.subplots(sharex=True, sharey=True)
fig.suptitle('Sharing both axes')
axs[0].plot(x, y ** 2)
axs[1].plot(x, 0.3 * y, 'o')
axs[2].plot(x, y, '+')

# Hide x labels and tick labels for all but bottom plot.
for ax in axs:
    ax.label_outer()
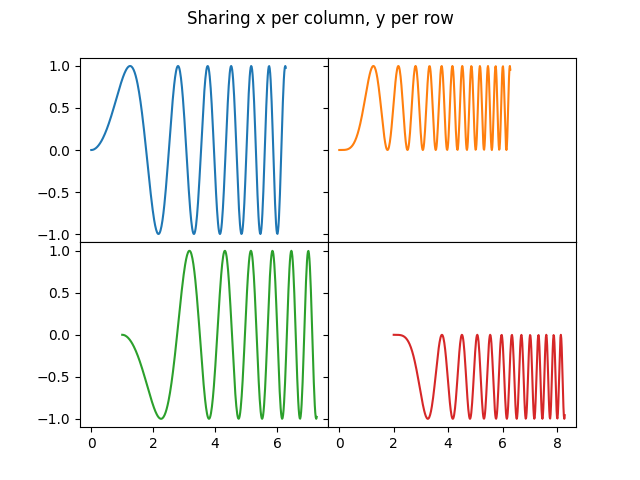
除了 True 和 False 之外,sharex 和 sharey 都接受 'row' 和 'col' 值,以便仅按行或按列共享值。
fig = plt.figure()
gs = fig.add_gridspec(2, 2, hspace=0, wspace=0)
(ax1, ax2), (ax3, ax4) = gs.subplots(sharex='col', sharey='row')
fig.suptitle('Sharing x per column, y per row')
ax1.plot(x, y)
ax2.plot(x, y**2, 'tab:orange')
ax3.plot(x + 1, -y, 'tab:green')
ax4.plot(x + 2, -y**2, 'tab:red')

for ax in fig.get_axes():
    ax.label_outer()
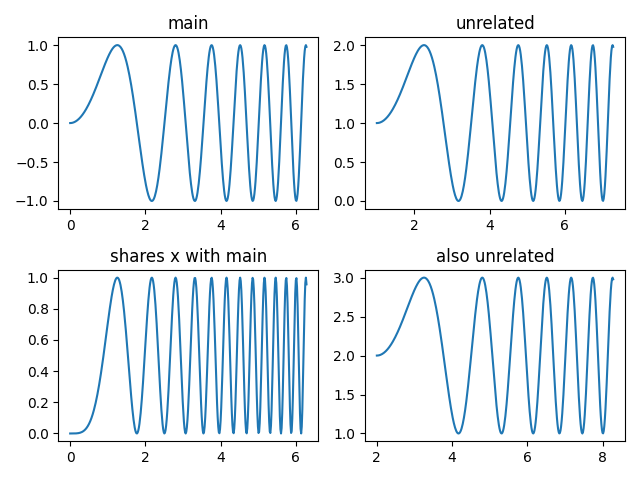
如果您需要更复杂的共享结构,您可以首先创建不共享的 Axes 网格,然后调用 axes.Axes.sharex 或 axes.Axes.sharey 以事后添加共享信息。
fig, axs = plt.subplots(2, 2)
axs[0, 0].plot(x, y)
axs[0, 0].set_title("main")
axs[1, 0].plot(x, y**2)
axs[1, 0].set_title("shares x with main")
axs[1, 0].sharex(axs[0, 0])
axs[0, 1].plot(x + 1, y + 1)
axs[0, 1].set_title("unrelated")
axs[1, 1].plot(x + 2, y + 2)
axs[1, 1].set_title("also unrelated")
fig.tight_layout()
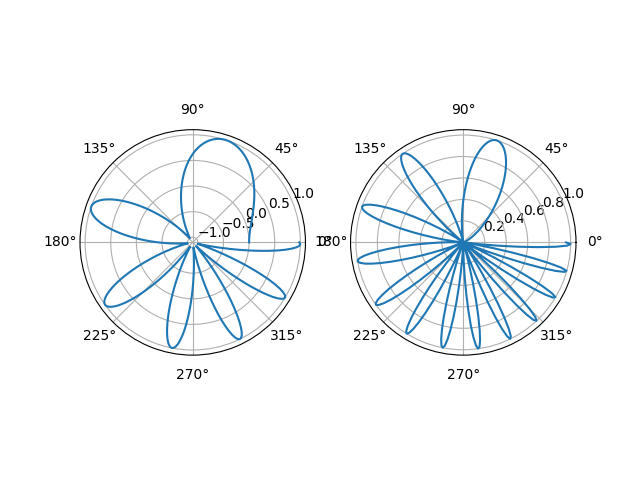
极坐标 Axes#
pyplot.subplots 的参数 subplot_kw 控制子图属性(另请参阅 Figure.add_subplot)。特别是,这可以用于创建极坐标 Axes 网格。
脚本总运行时间: (0 分 7.941 秒)