注意
跳转到末尾以下载完整示例代码。
虚线样式配置#
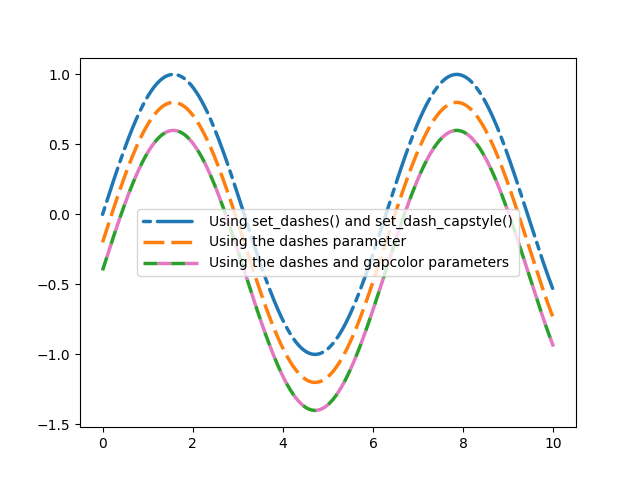
线条的虚线样式通过虚线序列控制。它可以使用 Line2D.set_dashes 进行修改。
虚线序列是一系列以点为单位的开/关长度,例如 [3, 1] 表示 3pt 长的线条,间隔 1pt 的空间。
一些函数,例如 Axes.plot,支持将线条属性作为关键字参数传递。在这种情况下,您可以在创建线条时就设置虚线样式。
注意:虚线样式也可以通过将虚线序列列表使用关键字 dashes 传递给循环器,从而通过 属性循环(property_cycle)进行配置。此示例中未显示此内容。
虚线的其他属性也可以通过相关方法(set_dash_capstyle、set_dash_joinstyle、set_gapcolor)设置,或通过绘图函数传递属性进行设置。
import matplotlib.pyplot as plt
import numpy as np

x = np.linspace(0, 10, 500)
y = np.sin(x)

plt.rc('lines', linewidth=2.5)
fig, ax = plt.subplots()

# Using set_dashes() and set_capstyle() to modify dashing of an existing line.
line1, = ax.plot(x, y, label='Using set_dashes() and set_dash_capstyle()')
line1.set_dashes([2, 2, 10, 2])  # 2pt line, 2pt break, 10pt line, 2pt break.
line1.set_dash_capstyle('round')

# Using plot(..., dashes=...) to set the dashing when creating a line.
line2, = ax.plot(x, y - 0.2, dashes=[6, 2], label='Using the dashes parameter')

# Using plot(..., dashes=..., gapcolor=...) to set the dashing and
# alternating color when creating a line.
line3, = ax.plot(x, y - 0.4, dashes=[4, 4], gapcolor='tab:pink',
                 label='Using the dashes and gapcolor parameters')

ax.legend(handlelength=4)
plt.show()

脚本总运行时间: (0分钟 1.004秒)