注意
跳转到末尾 下载完整的示例代码。
放置文本框#
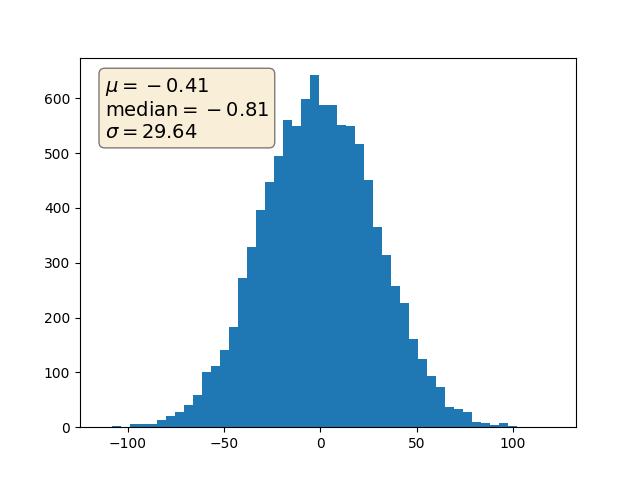
当使用文本框装饰坐标轴 (Axes) 时,有两个有用的技巧:将文本放置在坐标轴坐标系中(参见变换教程),这样文本不会随着 x 或 y 轴范围的变化而移动。您还可以使用文本的 bbox 属性,用一个 Patch 实例来包围文本—— bbox 关键字参数接受一个字典,其键是 Patch 属性。

import matplotlib.pyplot as plt
import numpy as np

np.random.seed(19680801)

fig, ax = plt.subplots()
x = 30*np.random.randn(10000)
mu = x.mean()
median = np.median(x)
sigma = x.std()
textstr = '\n'.join((
    r'$\mu=%.2f$' % (mu, ),
    r'$\mathrm{median}=%.2f$' % (median, ),
    r'$\sigma=%.2f$' % (sigma, )))

ax.hist(x, 50)
# these are matplotlib.patch.Patch properties
props = dict(boxstyle='round', facecolor='wheat', alpha=0.5)

# place a text box in upper left in axes coords
ax.text(0.05, 0.95, textstr, transform=ax.transAxes, fontsize=14,
        verticalalignment='top', bbox=props)

plt.show()