注意
跳转到末尾以下载完整的示例代码。
孵化样式参考#
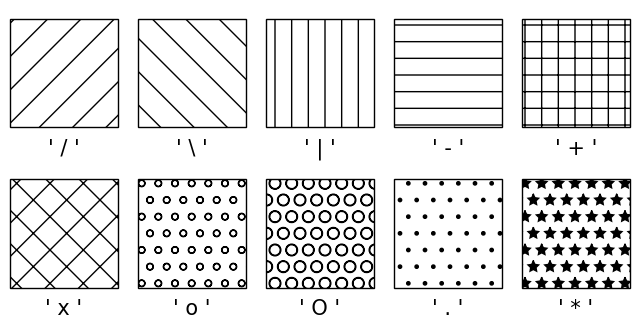
孵化样式可以添加到 Matplotlib 中的大多数多边形,包括 bar、fill_between、contourf 以及 Polygon 的子类。它们目前在 PS、PDF、SVG、macosx 和 Agg 后端中受支持。WX 和 Cairo 后端目前不支持孵化。
另请参阅 Contourf 孵化,了解使用 contourf 的示例,以及 孵化演示 以获取更多用法示例。
import matplotlib.pyplot as plt

from matplotlib.patches import Rectangle

fig, axs = plt.subplots(2, 5, layout='constrained', figsize=(6.4, 3.2))

hatches = ['/', '\\', '|', '-', '+', 'x', 'o', 'O', '.', '*']


def hatches_plot(ax, h):
    ax.add_patch(Rectangle((0, 0), 2, 2, fill=False, hatch=h))
    ax.text(1, -0.5, f"' {h} '", size=15, ha="center")
    ax.axis('equal')
    ax.axis('off')

for ax, h in zip(axs.flat, hatches):
    hatches_plot(ax, h)

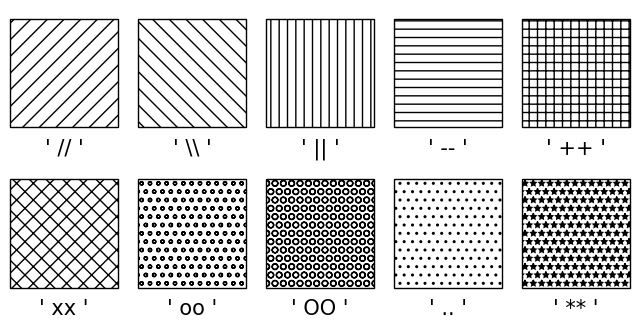
孵化图案可以重复以增加密度。

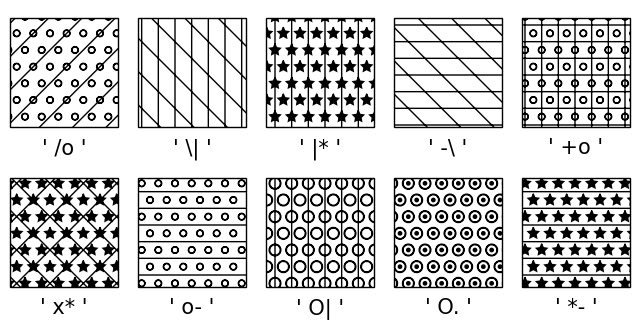
孵化图案可以组合以创建其他图案。

参考
本示例展示了以下函数、方法、类和模块的使用
脚本总运行时间: (0 分钟 1.658 秒)