注意
跳转到末尾以下载完整的示例代码。
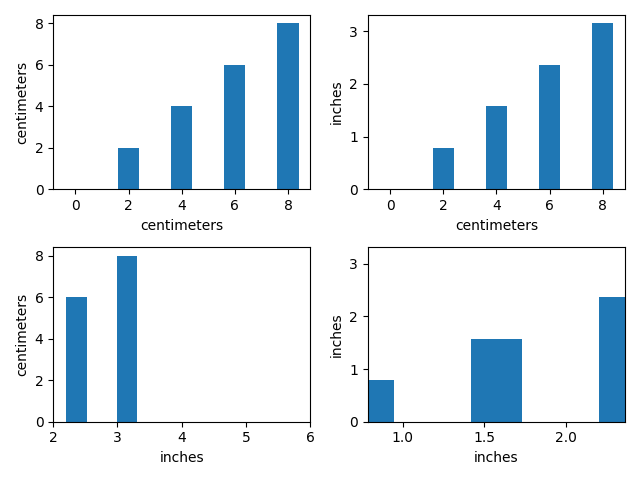
带单位的条形图演示#
一个使用多种厘米和英寸转换的绘图。此示例展示了默认单位内省的工作方式 (ax1),如何使用各种关键字来设置 x 和 y 单位以覆盖默认值 (ax2, ax3, ax4),以及如何使用标量(ax3,假设当前单位)或单位(应用转换以将数字转换为当前单位)来设置 x 轴限制。
此示例需要 basic_units.py
from basic_units import cm, inch

import matplotlib.pyplot as plt
import numpy as np

cms = cm * np.arange(0, 10, 2)
bottom = 0 * cm
width = 0.8 * cm

fig, axs = plt.subplots(2, 2)

axs[0, 0].bar(cms, cms, bottom=bottom)

axs[0, 1].bar(cms, cms, bottom=bottom, width=width, xunits=cm, yunits=inch)

axs[1, 0].bar(cms, cms, bottom=bottom, width=width, xunits=inch, yunits=cm)
axs[1, 0].set_xlim(2, 6)  # scalars are interpreted in current units

axs[1, 1].bar(cms, cms, bottom=bottom, width=width, xunits=inch, yunits=inch)
axs[1, 1].set_xlim(2 * cm, 6 * cm)  # cm are converted to inches

fig.tight_layout()
plt.show()