注意
跳转到末尾以下载完整示例代码。
多光标#
在多个绘图上同时显示光标。
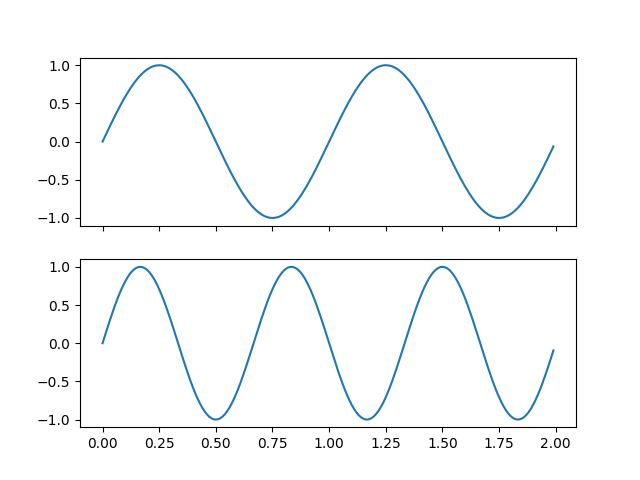
本示例生成三个轴,分布在两个不同的图中。当光标悬停在其中一个子图的数据上时,该数据点的值会在所有轴中显示。
import matplotlib.pyplot as plt
import numpy as np
from matplotlib.widgets import MultiCursor
t = np.arange(0.0, 2.0, 0.01)
s1 = np.sin(2*np.pi*t)
s2 = np.sin(3*np.pi*t)
s3 = np.sin(4*np.pi*t)
fig, (ax1, ax2) = plt.subplots(2, sharex=True)
ax1.plot(t, s1)
ax2.plot(t, s2)
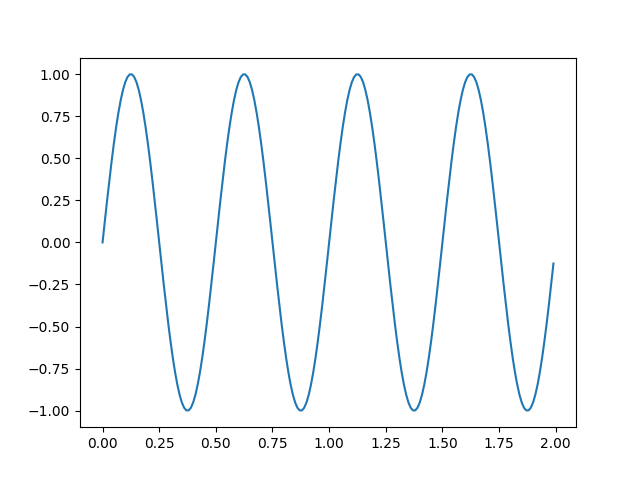
fig, ax3 = plt.subplots()
ax3.plot(t, s3)
multi = MultiCursor(None, (ax1, ax2, ax3), color='r', lw=1)
plt.show()
脚本总运行时间: (0 分钟 1.315 秒)