注意
跳转到末尾以下载完整示例代码。
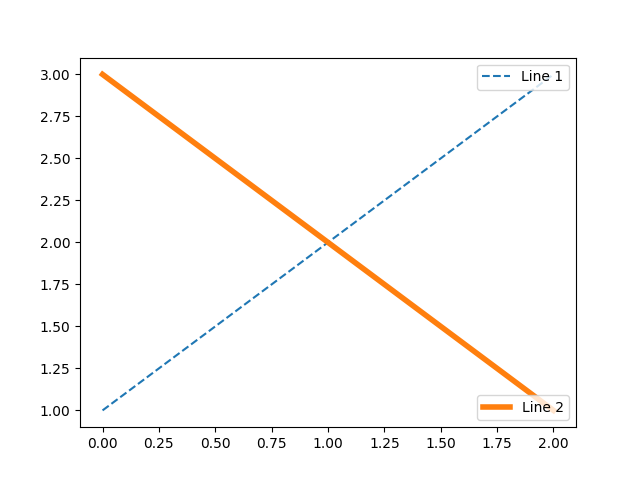
简单图例02#
import matplotlib.pyplot as plt

fig, ax = plt.subplots()

line1, = ax.plot([1, 2, 3], label="Line 1", linestyle='--')
line2, = ax.plot([3, 2, 1], label="Line 2", linewidth=4)

# Create a legend for the first line.
first_legend = ax.legend(handles=[line1], loc='upper right')

# Add the legend manually to the current Axes.
ax.add_artist(first_legend)

# Create another legend for the second line.
ax.legend(handles=[line2], loc='lower right')

plt.show()