注意
转到末尾 以下载完整的示例代码。
图例演示#
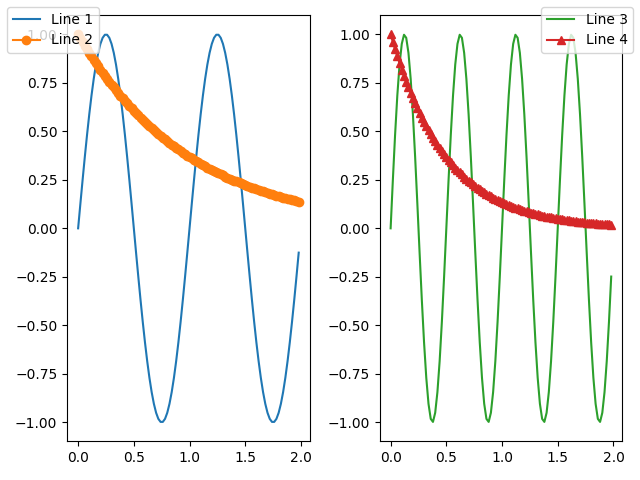
与其在每个坐标轴上绘制图例,不如为图中所有子坐标轴上的所有元素绘制一个图例。
import matplotlib.pyplot as plt
import numpy as np

fig, axs = plt.subplots(1, 2, layout='constrained')

x = np.arange(0.0, 4*np.pi, 0.2)
axs[0].plot(x, np.sin(x), label='Line 1')
axs[0].plot(x, np.exp(-x/2), marker='o', label='Line 2')
axs[1].plot(x, np.sin(x), color='tab:green', label='Line 3')
axs[1].plot(x, np.exp(-x/4), color='tab:red', marker='^', label='Line 4')

fig.legend(loc='outside right upper')

plt.show()

有关外部定位的详细讨论请参见此处:https://matplotlib.net.cn/stable/users/explain/axes/legend_guide.html#figure-legends
脚本总运行时间: (0 分 1.292 秒)