注意
跳到最后下载完整示例代码。
pcolormesh 网格和着色#
axes.Axes.pcolormesh 和 pcolor 对网格的布局和网格点之间的着色有几个选项。
通常,如果 Z 的形状是 (M, N),那么网格 X 和 Y 可以指定为形状 (M+1, N+1) 或 (M, N),具体取决于 shading 关键字参数的值。请注意,在下面我们指定向量 x 的长度为 N 或 N+1,y 的长度为 M 或 M+1,并且 pcolormesh 会根据输入向量在内部生成网格矩阵 X 和 Y。
import matplotlib.pyplot as plt
import numpy as np
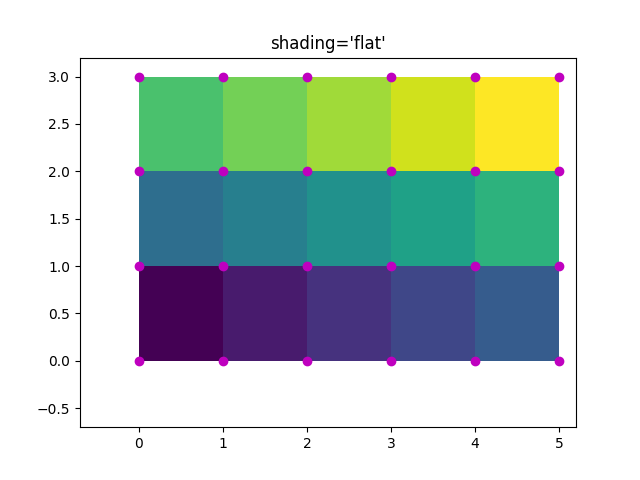
平面着色#
最少假设的网格规范是 shading='flat',并且如果网格在每个维度上比数据大一,即形状为 (M+1, N+1)。在这种情况下,X 和 Y 指定了四边形的角点,这些四边形用 Z 中的值着色。这里我们用 X 和 Y(形状为 (4, 6))来指定 (3, 5) 四边形的边缘。
nrows = 3
ncols = 5
Z = np.arange(nrows * ncols).reshape(nrows, ncols)
x = np.arange(ncols + 1)
y = np.arange(nrows + 1)

fig, ax = plt.subplots()
ax.pcolormesh(x, y, Z, shading='flat', vmin=Z.min(), vmax=Z.max())


def _annotate(ax, x, y, title):
    # this all gets repeated below:
    X, Y = np.meshgrid(x, y)
    ax.plot(X.flat, Y.flat, 'o', color='m')
    ax.set_xlim(-0.7, 5.2)
    ax.set_ylim(-0.7, 3.2)
    ax.set_title(title)

_annotate(ax, x, y, "shading='flat'")
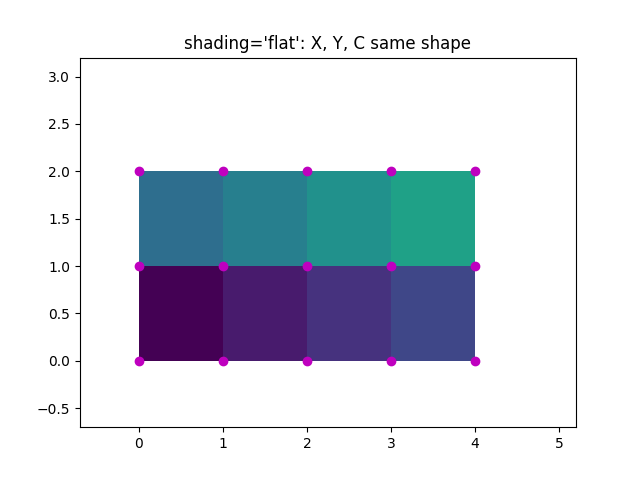
平面着色,相同形状网格#
然而,数据通常提供 X 和 Y 与 Z 形状匹配的情况。虽然这对于其他 shading 类型有意义,但在 shading='flat' 时不允许。历史上,Matplotlib 在这种情况下会默默地删除 Z 的最后一行和最后一列,以匹配 Matlab 的行为。如果仍然需要这种行为,只需手动删除最后一行和最后一列即可
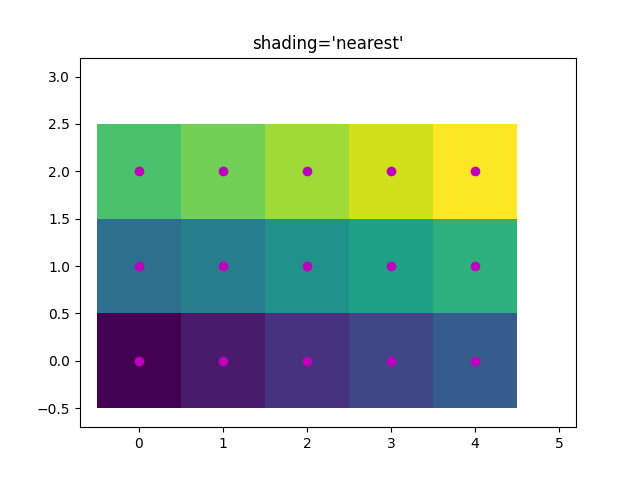
最近邻着色,相同形状网格#
通常,当用户使 X、Y 和 Z 具有相同形状时,删除一行和一列数据并不是用户的本意。对于这种情况,Matplotlib 允许 shading='nearest',并将有色四边形居中于网格点。
如果使用 shading='nearest' 传入了不正确形状的网格,则会引发错误。
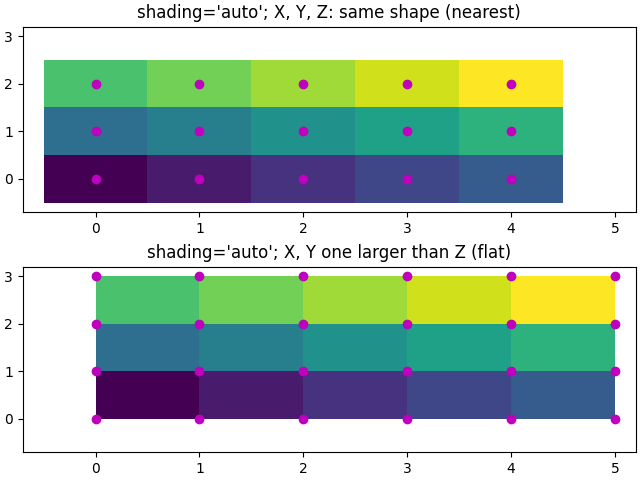
自动着色#
用户可能希望代码自动选择使用哪种着色,在这种情况下,shading='auto' 将根据 X、Y 和 Z 的形状决定使用“flat”还是“nearest”着色。
fig, axs = plt.subplots(2, 1, layout='constrained')
ax = axs[0]
x = np.arange(ncols)
y = np.arange(nrows)
ax.pcolormesh(x, y, Z, shading='auto', vmin=Z.min(), vmax=Z.max())
_annotate(ax, x, y, "shading='auto'; X, Y, Z: same shape (nearest)")

ax = axs[1]
x = np.arange(ncols + 1)
y = np.arange(nrows + 1)
ax.pcolormesh(x, y, Z, shading='auto', vmin=Z.min(), vmax=Z.max())
_annotate(ax, x, y, "shading='auto'; X, Y one larger than Z (flat)")
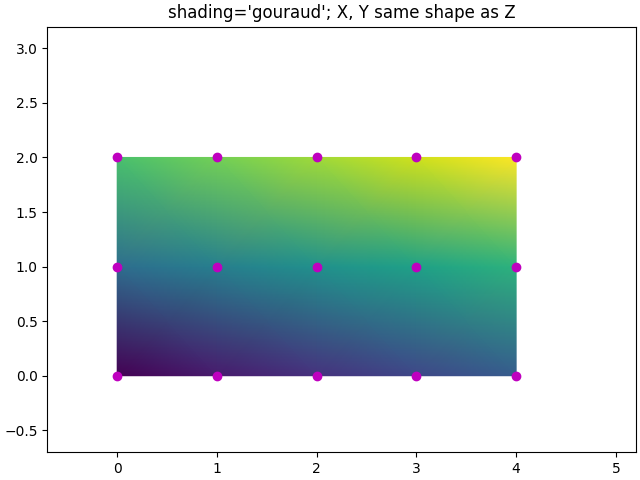
Gouraud 着色#
也可以指定Gouraud 着色,其中四边形中的颜色在网格点之间进行线性插值。X、Y、Z 的形状必须相同。
脚本总运行时间: (0 分 5.039 秒)