注意
前往末尾下载完整示例代码。
标题定位#
Matplotlib 可以将图表标题显示为居中对齐、与一组 Axes(坐标系)左侧对齐,或与一组 Axes 右侧对齐。
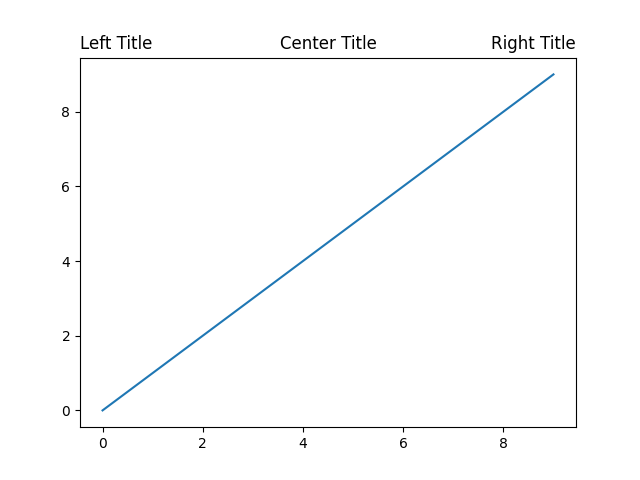
垂直位置会自动选择,以避免与最顶部的 X 轴上的装饰(即标签和刻度)重叠。
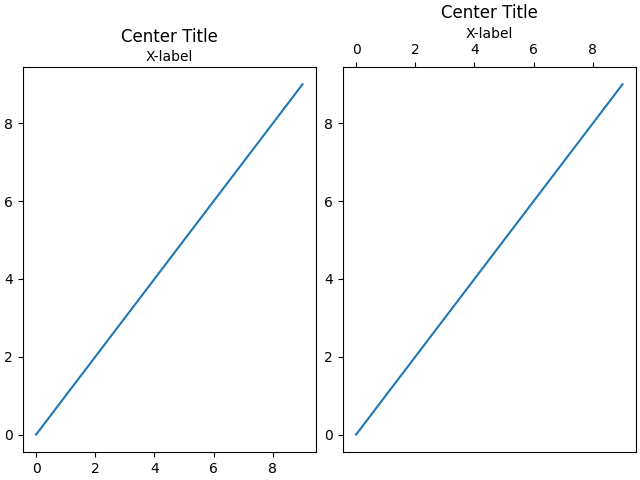
fig, axs = plt.subplots(1, 2, layout='constrained')

ax = axs[0]
ax.plot(range(10))
ax.xaxis.set_label_position('top')
ax.set_xlabel('X-label')
ax.set_title('Center Title')

ax = axs[1]
ax.plot(range(10))
ax.xaxis.set_label_position('top')
ax.xaxis.tick_top()
ax.set_xlabel('X-label')
ax.set_title('Center Title')
plt.show()
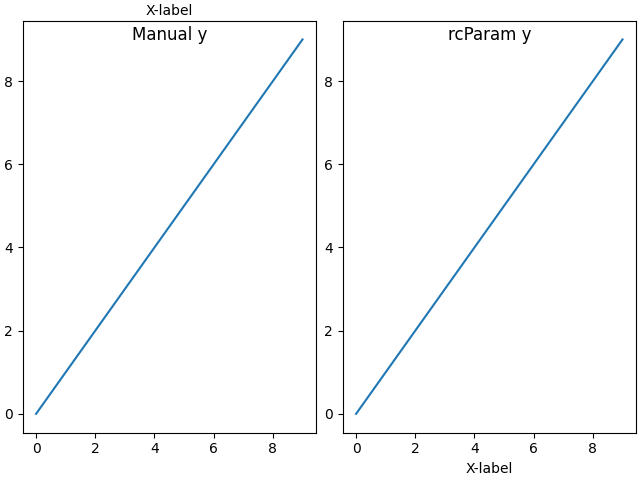
自动定位可以通过手动为标题指定 y 关键字参数来关闭,或者在 rcParams 中设置 rcParams["axes.titley"](默认值:None)。
fig, axs = plt.subplots(1, 2, layout='constrained')

ax = axs[0]
ax.plot(range(10))
ax.xaxis.set_label_position('top')
ax.set_xlabel('X-label')
ax.set_title('Manual y', y=1.0, pad=-14)

plt.rcParams['axes.titley'] = 1.0    # y is in axes-relative coordinates.
plt.rcParams['axes.titlepad'] = -14  # pad is in points...
ax = axs[1]
ax.plot(range(10))
ax.set_xlabel('X-label')
ax.set_title('rcParam y')

plt.show()
脚本总运行时间: (0 分钟 1.973 秒)