注意
转到末尾 以下载完整的示例代码。
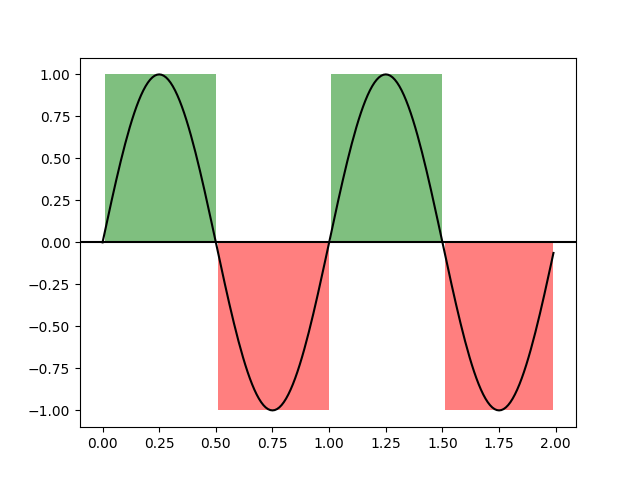
使用fill_between为逻辑掩码定义的区域着色#
import matplotlib.pyplot as plt
import numpy as np

t = np.arange(0.0, 2, 0.01)
s = np.sin(2*np.pi*t)

fig, ax = plt.subplots()

ax.plot(t, s, color='black')
ax.axhline(0, color='black')

ax.fill_between(t, 1, where=s > 0, facecolor='green', alpha=.5)
ax.fill_between(t, -1, where=s < 0, facecolor='red', alpha=.5)

plt.show()