注意
前往末尾 下载完整的示例代码。
条形码#
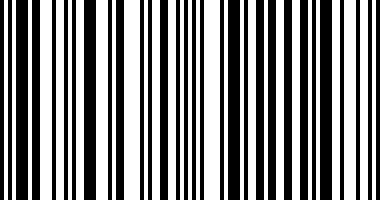
本演示展示了如何生成条形码。
计算图形大小,使像素宽度为数据点数量的倍数,以防止插值伪影。此外,Axes 被定义为跨越整个图形,并且所有 Axis 都已关闭。
数据本身通过 imshow 进行渲染,具体如下:
code.reshape(1, -1)将数据转换为一行二维数组。imshow(..., aspect='auto')允许非方形像素。imshow(..., interpolation='nearest')以防止边缘模糊。无论如何,这应该不会发生,因为我们已经微调了图形的像素宽度,但这只是为了安全起见。
import matplotlib.pyplot as plt
import numpy as np

code = np.array([
    1, 0, 1, 0, 1, 1, 1, 0, 1, 1, 0, 0, 0, 1, 0, 0, 1, 0, 1, 0, 0, 1, 1, 1,
    0, 0, 0, 1, 0, 1, 1, 0, 0, 0, 0, 1, 0, 1, 0, 0, 1, 1, 0, 0, 1, 0, 1, 0,
    1, 0, 1, 0, 0, 0, 0, 1, 0, 1, 1, 1, 0, 1, 0, 0, 1, 1, 0, 1, 1, 0, 0, 1,
    1, 0, 0, 1, 1, 0, 1, 0, 1, 1, 1, 0, 0, 1, 0, 0, 0, 1, 0, 0, 1, 0, 1])

pixel_per_bar = 4
dpi = 100

fig = plt.figure(figsize=(len(code) * pixel_per_bar / dpi, 2), dpi=dpi)
ax = fig.add_axes([0, 0, 1, 1])  # span the whole figure
ax.set_axis_off()
ax.imshow(code.reshape(1, -1), cmap='binary', aspect='auto',
          interpolation='nearest')
plt.show()

参考
本示例展示了以下函数、方法、类和模块的使用