注意
跳转到末尾 以下载完整示例代码。
带刻度路径效果的线条#
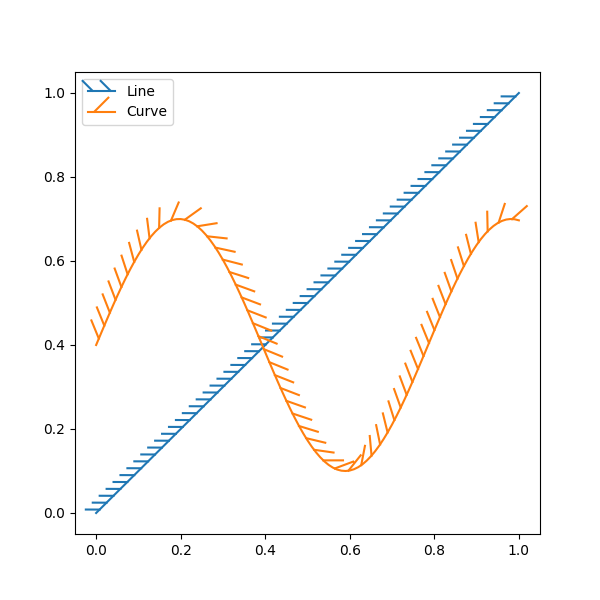
可以使用 TickedStroke 沿着线条添加刻度,以将一侧标记为障碍。您可以控制刻度的角度、间距和长度。
刻度也会适当地显示在图例中。
import matplotlib.pyplot as plt
import numpy as np

from matplotlib import patheffects

# Plot a straight diagonal line with ticked style path
fig, ax = plt.subplots(figsize=(6, 6))
ax.plot([0, 1], [0, 1], label="Line",
        path_effects=[patheffects.withTickedStroke(spacing=7, angle=135)])

# Plot a curved line with ticked style path
nx = 101
x = np.linspace(0.0, 1.0, nx)
y = 0.3*np.sin(x*8) + 0.4
ax.plot(x, y, label="Curve", path_effects=[patheffects.withTickedStroke()])

ax.legend()

plt.show()
