注意
前往末尾 下载完整示例代码。
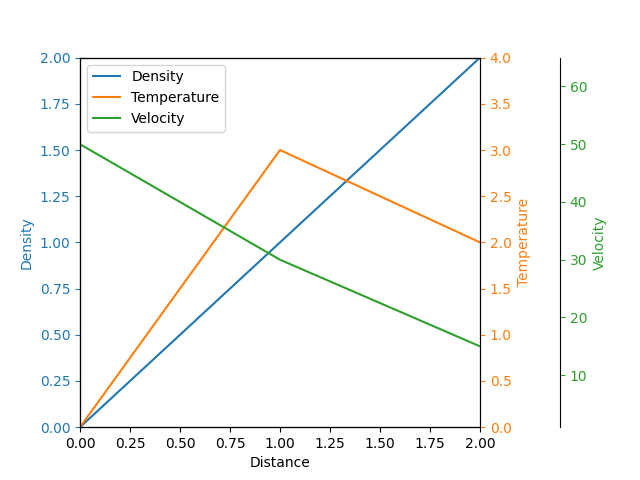
带轴线的多Y轴#
创建一个具有共享X轴的多个Y轴。这通过创建一个twinx 轴,将除右侧轴线外的所有轴线设置为不可见,并使用set_position 偏移其位置。
请注意,此方法使用matplotlib.axes.Axes 及其Spine 对象。使用非标准轴的替代方法在寄生轴演示 和寄生轴演示 示例中展示。

import matplotlib.pyplot as plt

fig, ax = plt.subplots()
fig.subplots_adjust(right=0.75)

twin1 = ax.twinx()
twin2 = ax.twinx()

# Offset the right spine of twin2.  The ticks and label have already been
# placed on the right by twinx above.
twin2.spines.right.set_position(("axes", 1.2))

p1, = ax.plot([0, 1, 2], [0, 1, 2], "C0", label="Density")
p2, = twin1.plot([0, 1, 2], [0, 3, 2], "C1", label="Temperature")
p3, = twin2.plot([0, 1, 2], [50, 30, 15], "C2", label="Velocity")

ax.set(xlim=(0, 2), ylim=(0, 2), xlabel="Distance", ylabel="Density")
twin1.set(ylim=(0, 4), ylabel="Temperature")
twin2.set(ylim=(1, 65), ylabel="Velocity")

ax.yaxis.label.set_color(p1.get_color())
twin1.yaxis.label.set_color(p2.get_color())
twin2.yaxis.label.set_color(p3.get_color())

ax.tick_params(axis='y', colors=p1.get_color())
twin1.tick_params(axis='y', colors=p2.get_color())
twin2.tick_params(axis='y', colors=p3.get_color())

ax.legend(handles=[p1, p2, p3])

plt.show()