注意
跳到末尾 下载完整的示例代码。
频谱图#
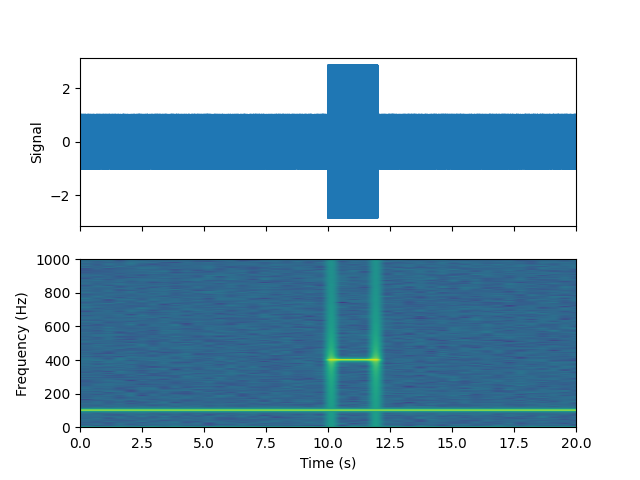
使用 specgram 绘制频谱图。
import matplotlib.pyplot as plt
import numpy as np

# Fixing random state for reproducibility
np.random.seed(19680801)

dt = 0.0005
t = np.arange(0.0, 20.5, dt)
s1 = np.sin(2 * np.pi * 100 * t)
s2 = 2 * np.sin(2 * np.pi * 400 * t)

# create a transient "chirp"
s2[t <= 10] = s2[12 <= t] = 0

# add some noise into the mix
nse = 0.01 * np.random.random(size=len(t))

x = s1 + s2 + nse  # the signal
NFFT = 1024  # the length of the windowing segments
Fs = 1/dt  # the sampling frequency

fig, (ax1, ax2) = plt.subplots(nrows=2, sharex=True)
ax1.plot(t, x)
ax1.set_ylabel('Signal')

Pxx, freqs, bins, im = ax2.specgram(x, NFFT=NFFT, Fs=Fs)
# The `specgram` method returns 4 objects. They are:
# - Pxx: the periodogram
# - freqs: the frequency vector
# - bins: the centers of the time bins
# - im: the .image.AxesImage instance representing the data in the plot
ax2.set_xlabel('Time (s)')
ax2.set_ylabel('Frequency (Hz)')
ax2.set_xlim(0, 20)

plt.show()

脚本总运行时间: (0 分 2.245 秒)