注意
转到末尾下载完整示例代码。
轴脊#
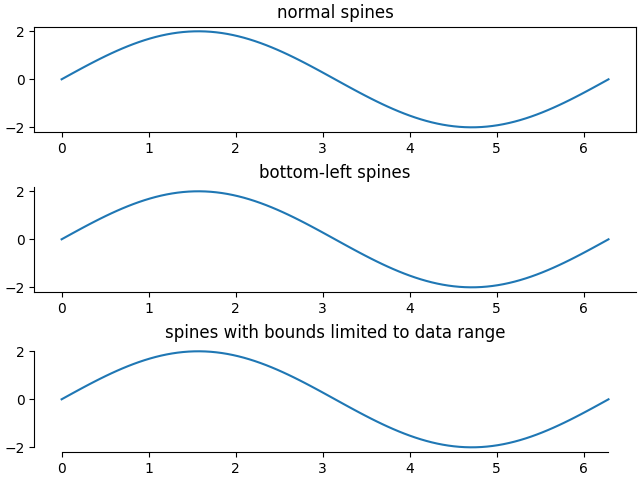
本示例比较了
普通坐标轴,四边都有轴线;
只有左侧和底部有轴线的坐标轴;
使用自定义边界限制轴线范围的坐标轴。
每个axes.Axes都有一个Spine对象列表,可通过容器ax.spines访问。
import matplotlib.pyplot as plt
import numpy as np

x = np.linspace(0, 2 * np.pi, 100)
y = 2 * np.sin(x)

# Constrained layout makes sure the labels don't overlap the Axes.
fig, (ax0, ax1, ax2) = plt.subplots(nrows=3, layout='constrained')

ax0.plot(x, y)
ax0.set_title('normal spines')

ax1.plot(x, y)
ax1.set_title('bottom-left spines')

# Hide the right and top spines
ax1.spines.right.set_visible(False)
ax1.spines.top.set_visible(False)

ax2.plot(x, y)
ax2.set_title('spines with bounds limited to data range')

# Only draw spines for the data range, not in the margins
ax2.spines.bottom.set_bounds(x.min(), x.max())
ax2.spines.left.set_bounds(y.min(), y.max())
# Hide the right and top spines
ax2.spines.right.set_visible(False)
ax2.spines.top.set_visible(False)

plt.show()