注意
跳转到末尾 下载完整示例代码。
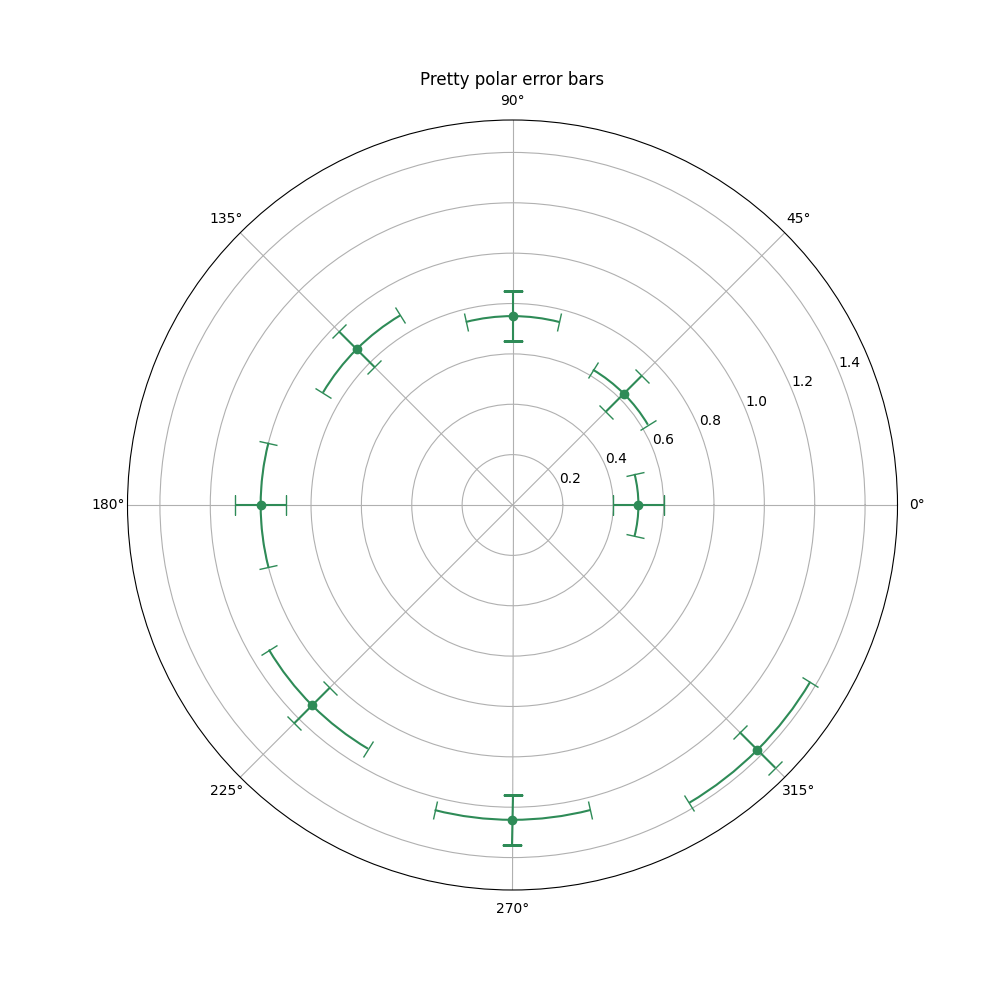
极坐标轴上的误差棒渲染#
极坐标系中误差棒图的演示。角度(theta)误差棒是弯曲的线条,末端带有朝向中心的帽(cap)。半径误差棒是直线,朝向中心,并带有垂直的帽。
import matplotlib.pyplot as plt
import numpy as np

theta = np.arange(0, 2 * np.pi, np.pi / 4)
r = theta / np.pi / 2 + 0.5

fig = plt.figure(figsize=(10, 10))
ax = fig.add_subplot(projection='polar')
ax.errorbar(theta, r, xerr=0.25, yerr=0.1, capsize=7, fmt="o", c="seagreen")
ax.set_title("Pretty polar error bars")
plt.show()
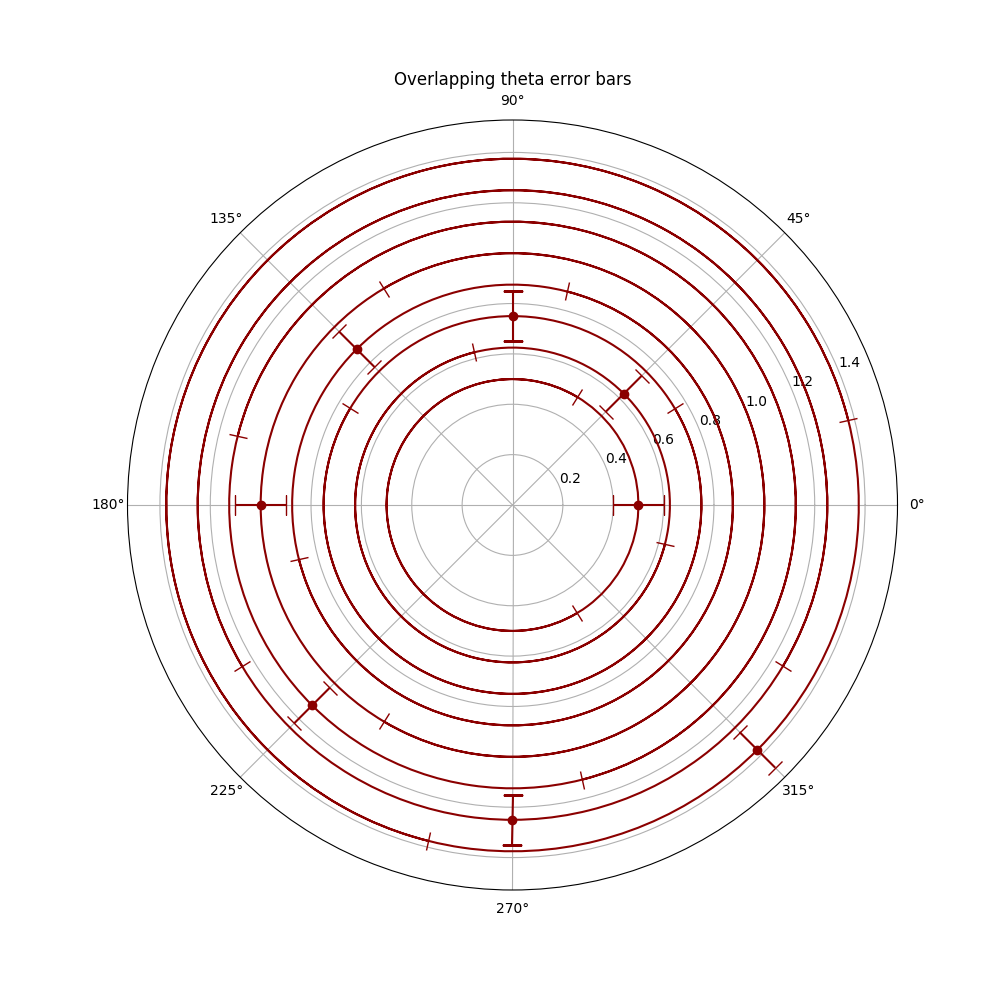
请注意,大的角度(theta)误差棒会重叠。这可能会降低输出图的可读性。请参见下面的示例图。
fig = plt.figure(figsize=(10, 10))
ax = fig.add_subplot(projection='polar')
ax.errorbar(theta, r, xerr=5.25, yerr=0.1, capsize=7, fmt="o", c="darkred")
ax.set_title("Overlapping theta error bars")
plt.show()
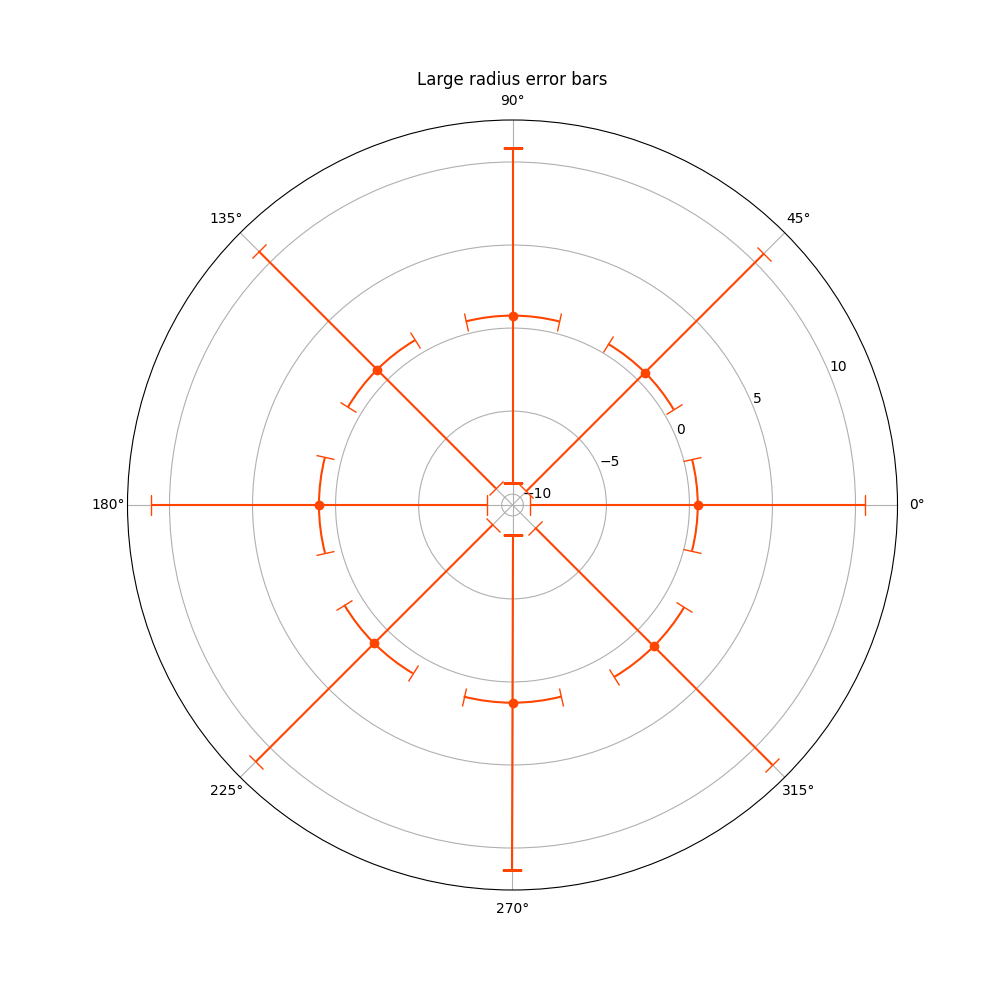
另一方面,大的半径误差棒永远不会重叠,它们只会导致数据中出现不希望的比例,从而缩小显示范围。
fig = plt.figure(figsize=(10, 10))
ax = fig.add_subplot(projection='polar')
ax.errorbar(theta, r, xerr=0.25, yerr=10.1, capsize=7, fmt="o", c="orangered")
ax.set_title("Large radius error bars")
plt.show()
参考
本示例展示了以下函数、方法、类和模块的使用
脚本总运行时间: (0 分钟 3.631 秒)