注意
要下载完整的示例代码,请转到末尾。
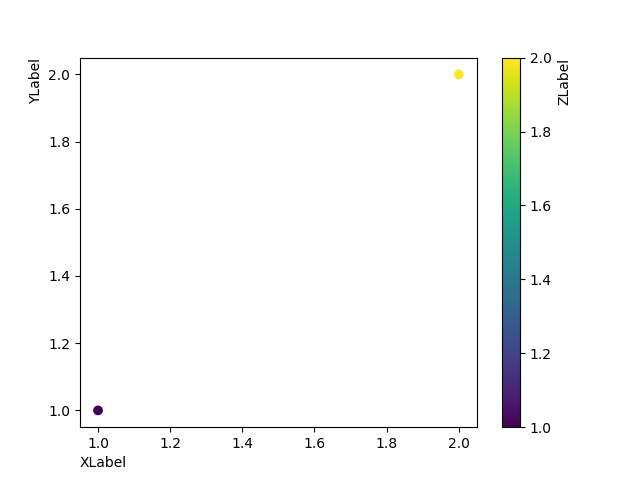
坐标轴标签位置#
调用set_xlabel和set_ylabel时选择坐标轴标签位置,也适用于色条。
import matplotlib.pyplot as plt

fig, ax = plt.subplots()

sc = ax.scatter([1, 2], [1, 2], c=[1, 2])
ax.set_ylabel('YLabel', loc='top')
ax.set_xlabel('XLabel', loc='left')
cbar = fig.colorbar(sc)
cbar.set_label("ZLabel", loc='top')

plt.show()