注意
转到末尾以下载完整的示例代码。
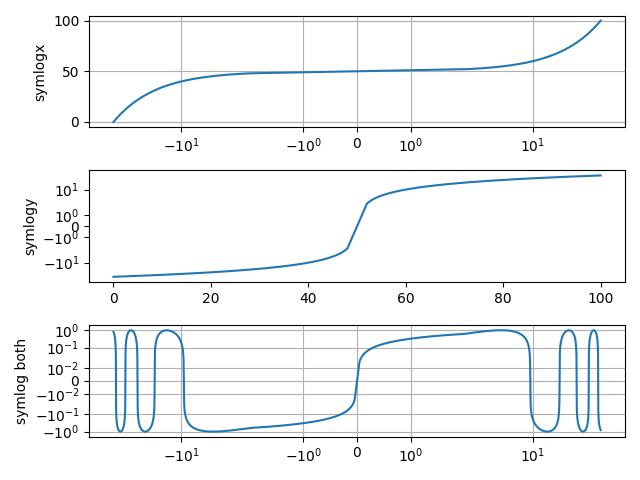
Symlog 刻度#
对称对数刻度是对数刻度的一种扩展,它也涵盖负值。与对数刻度一样,它对于跨越广泛数值范围的数值数据特别有用,尤其是在所涉及数字的量级之间存在显著差异时。
symlog(对称对数)轴刻度使用的示例。
import matplotlib.pyplot as plt
import numpy as np

dt = 0.01
x = np.arange(-50.0, 50.0, dt)
y = np.arange(0, 100.0, dt)

fig, (ax0, ax1, ax2) = plt.subplots(nrows=3)

ax0.plot(x, y)
ax0.set_xscale('symlog')
ax0.set_ylabel('symlogx')
ax0.grid()
ax0.xaxis.grid(which='minor')  # minor grid on too

ax1.plot(y, x)
ax1.set_yscale('symlog')
ax1.set_ylabel('symlogy')

ax2.plot(x, np.sin(x / 3.0))
ax2.set_xscale('symlog')
ax2.set_yscale('symlog', linthresh=0.015)
ax2.grid()
ax2.set_ylabel('symlog both')

fig.tight_layout()
plt.show()
线性阈值#
由于对数刻度上的每个十年都覆盖相同的视觉空间量,并且给定数字与零之间有无限多个十年,因此symlog刻度必须在小范围 (-linthresh, linthresh) 内偏离对数映射,以便该范围映射到有限的视觉空间。
def format_axes(ax, title=None):
    """A helper function to better visualize properties of the symlog scale."""
    ax.xaxis.get_minor_locator().set_params(subs=[2, 3, 4, 5, 6, 7, 8, 9])
    ax.grid()
    ax.xaxis.grid(which='minor')  # minor grid on too
    linthresh = ax.xaxis.get_transform().linthresh
    linscale = ax.xaxis.get_transform().linscale
    ax.axvspan(-linthresh, linthresh, color='0.9')
    if title:
        ax.set_title(title.format(linthresh=linthresh, linscale=linscale))


x = np.linspace(-60, 60, 201)
y = np.linspace(0, 100.0, 201)

fig, (ax1, ax2) = plt.subplots(nrows=2, layout="constrained")

ax1.plot(x, y)
ax1.set_xscale('symlog', linthresh=1)
format_axes(ax1, title='Linear region: linthresh={linthresh}')

ax2.plot(x, y)
ax2.set_xscale('symlog', linthresh=5)
format_axes(ax2, title='Linear region: linthresh={linthresh}')
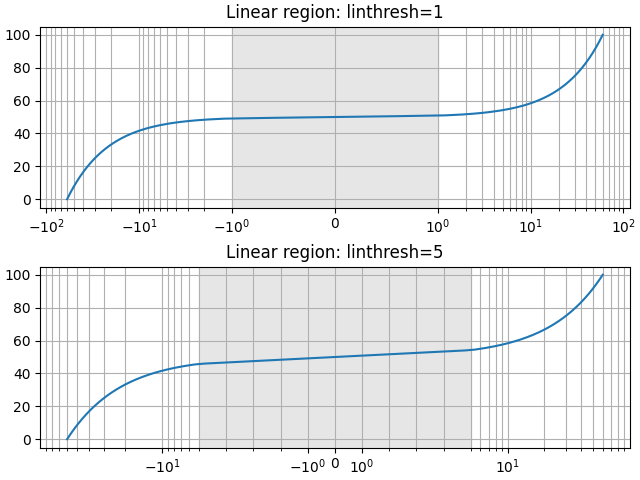
通常,应选择 linthresh,使线性区域中没有或只有少数数据点。根据经验,\(linthresh \approx \mathrm{min} |x|\)。
线性刻度#
此外,linscale 参数确定线性范围应使用多少视觉空间。更确切地说,它定义了区域 (0, linthresh) 相对于一个十年的视觉空间比例。
fig, (ax1, ax2) = plt.subplots(nrows=2, layout="constrained")

ax1.plot(x, y)
ax1.set_xscale('symlog', linthresh=1)
format_axes(ax1, title='Linear region: linthresh={linthresh}, linscale={linscale}')

ax2.plot(x, y)
ax2.set_xscale('symlog', linthresh=1, linscale=0.1)
format_axes(ax2, title='Linear region: linthresh={linthresh}, linscale={linscale}')
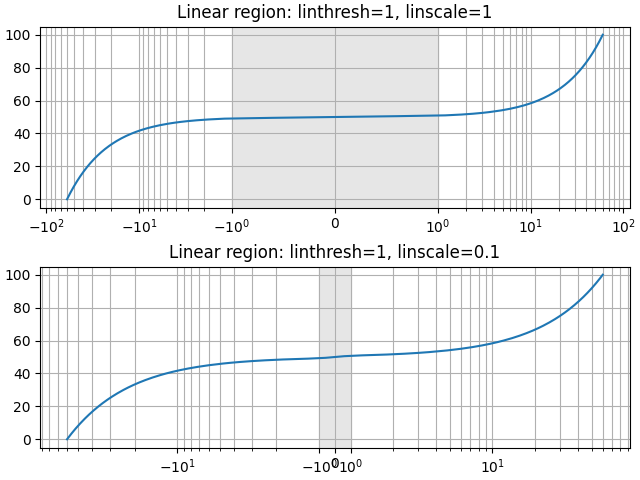
linscale 的合适值取决于数据的动态范围。由于大多数数据将在线性区域之外,因此您通常会使线性区域仅覆盖视觉面积的一小部分。
限制和替代方案#
由 symlog 使用的坐标变换在其线性区域和对数区域之间的过渡处具有不连续的梯度。根据数据和缩放比例,这在绘图中会或多或少地明显。
fig, ax = plt.subplots()
ax.plot(x, y)
ax.set_xscale('symlog', linscale=0.05)
format_axes(ax, title="Discontinuous gradient at linear/log transition")
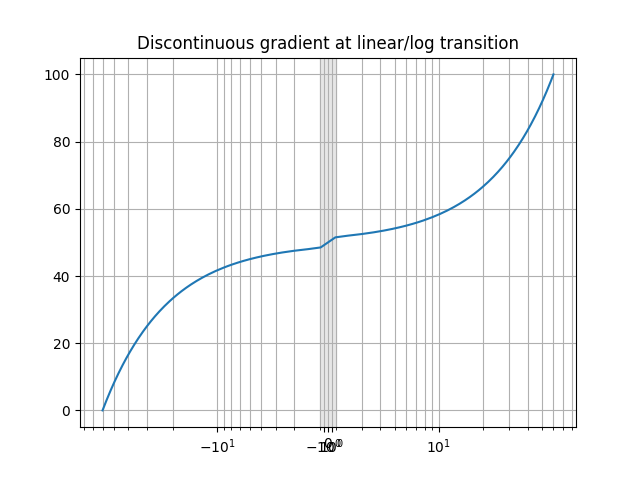
asinh 轴刻度是一种替代变换,它支持具有平滑梯度的宽动态范围,因此可以避免此类视觉伪影。请参阅 Asinh 刻度。
参考
脚本总运行时间: (0 分钟 3.528 秒)