matplotlib.figure.Figure.add_subplot#
- Figure.add_subplot(*args, **kwargs)[源]#
将一个
Axes添加到图形中,作为子图布局的一部分。调用签名
add_subplot(nrows, ncols, index, **kwargs)
add_subplot(pos, **kwargs)
add_subplot(ax)
add_subplot()
- 参数:
- *args整数, (整数, 整数, 索引), 或
SubplotSpec, 默认值: (1, 1, 1) 由以下之一描述的子图位置
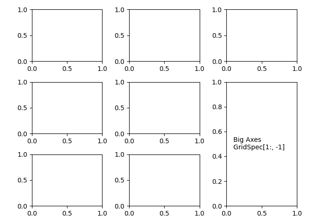
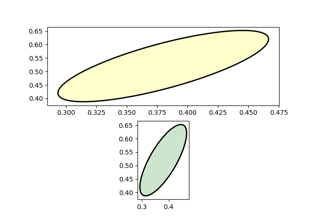
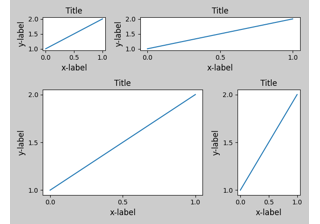
三个整数(nrows, ncols, index)。子图将占据由 nrows 行和 ncols 列组成的网格上的 index 位置。index 从左上角开始,值为 1,然后向右递增。index 也可以是一个二元组,指定子图的(first,last)索引(从 1 开始,并包含 last),例如,
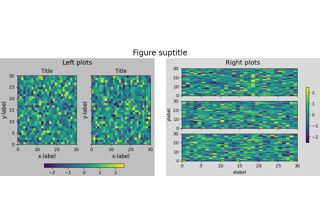
fig.add_subplot(3, 1, (1, 2))创建一个占据图形上方 2/3 的子图。一个三位整数。这些数字将被解释为单独给出的三个一位整数,即
fig.add_subplot(235)与fig.add_subplot(2, 3, 5)相同。请注意,这只能在子图数量不超过 9 个时使用。一个
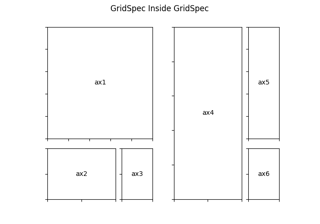
SubplotSpec。
在极少数情况下,
add_subplot可以只带一个参数调用,该参数是一个已在当前图形中创建但不在图形 Axes 列表中的子图 Axes 实例。- projection{None, 'aitoff', 'hammer', 'lambert', 'mollweide', 'polar', 'rectilinear', str}, 可选
子图的投影类型(
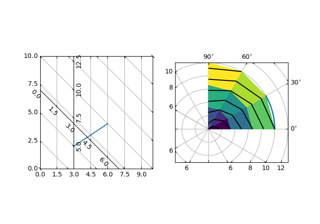
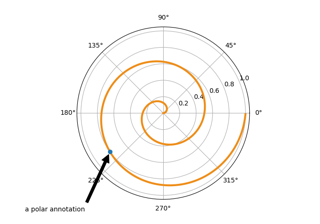
Axes)。str 是自定义投影的名称,请参阅projections。默认值 None 会生成“rectilinear”(直角坐标系)投影。- polarbool, 默认值: False
如果为 True,相当于 projection='polar'。
- axes_class
Axes的子类类型,可选 被实例化的
axes.Axes子类。此参数与 projection 和 polar 不兼容。请参阅 axisartist 获取示例。- sharex, sharey
Axes,可选 与 sharex 和/或 sharey 共享 x 或 y
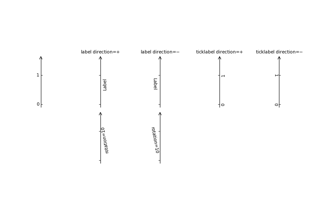
轴。该轴将与共享 Axes 的轴具有相同的限制、刻度和比例。- label字符串
返回的 Axes 的标签。
- *args整数, (整数, 整数, 索引), 或
- 返回:
Axes子图的 Axes(坐标轴)。返回的 Axes 实际上可以是子类的实例,例如用于极坐标投影的
projections.polar.PolarAxes。
- 其他参数:
- **kwargs
此方法还接受返回的 Axes 基类的关键字参数;但 figure 参数除外。直角坐标系基类
Axes的关键字参数可以在下表中找到,但如果使用其他投影,可能还有其他关键字参数。属性
描述
{'box', 'datalim'}
一个过滤函数,它接受一个 (m, n, 3) 浮点数组和一个 dpi 值,并返回一个 (m, n, 3) 数组以及图像左下角的两个偏移量
浮点数或 None
(float, float) 或 {'C', 'SW', 'S', 'SE', 'E', 'NE', ...}
布尔值
{'auto', 'equal'} 或 float
布尔值
未知
未知
Callable[[Axes, Renderer], Bbox]
布尔值 或 'line'
浮点数或 None
BboxBase或 None布尔值
Patch 或 (Path, Transform) 或 None
bool 或 "auto"
布尔值
字符串
布尔值
对象
布尔值
布尔值
未知
None 或 布尔值 或 浮点数 或 可调用对象
[left, bottom, width, height] 或
Bbox浮点数或 None
布尔值
(scale: 浮点数, length: 浮点数, randomness: 浮点数)
布尔值或 None
未知
字符串
字符串
布尔值
(下限: 浮点数, 上限: 浮点数)
字符串
(左侧: 浮点数, 右侧: 浮点数)
float 大于 -0.5
未知
未知
未知
(下限: 浮点数, 上限: 浮点数)
字符串
(底部: 浮点数, 顶部: 浮点数)
float 大于 -0.5
未知
未知
未知
浮点数
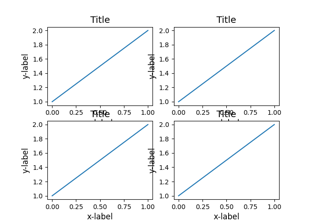
示例
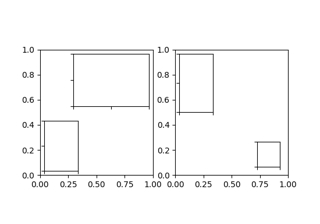
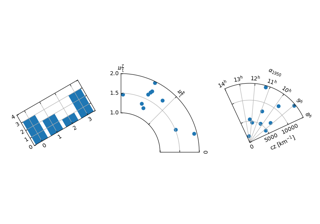
fig = plt.figure()

fig.add_subplot(231)
ax1 = fig.add_subplot(2, 3, 1)  # equivalent but more general

fig.add_subplot(232, frameon=False)  # subplot with no frame
fig.add_subplot(233, projection='polar')  # polar subplot
fig.add_subplot(234, sharex=ax1)  # subplot sharing x-axis with ax1
fig.add_subplot(235, facecolor="red")  # red subplot

ax1.remove()  # delete ax1 from the figure
fig.add_subplot(ax1)  # add ax1 back to the figure