注意
跳转到末尾以下载完整示例代码。
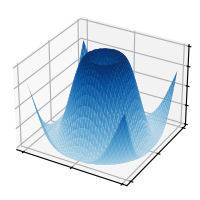
plot_surface(X, Y, Z)#
参见 plot_surface。
import matplotlib.pyplot as plt
import numpy as np

from matplotlib import cm

plt.style.use('_mpl-gallery')

# Make data
X = np.arange(-5, 5, 0.25)
Y = np.arange(-5, 5, 0.25)
X, Y = np.meshgrid(X, Y)
R = np.sqrt(X**2 + Y**2)
Z = np.sin(R)

# Plot the surface
fig, ax = plt.subplots(subplot_kw={"projection": "3d"})
ax.plot_surface(X, Y, Z, vmin=Z.min() * 2, cmap=cm.Blues)

ax.set(xticklabels=[],
       yticklabels=[],
       zticklabels=[])

plt.show()