绘制和标注纬线和经线
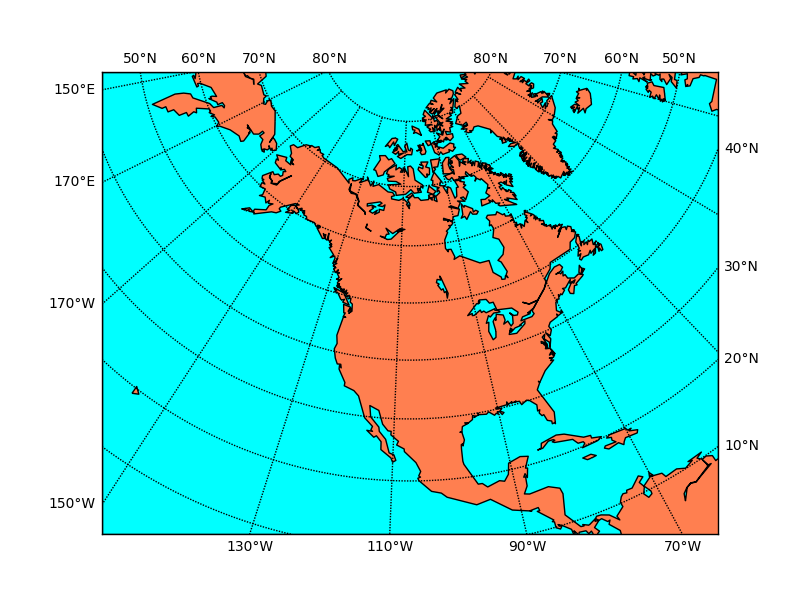
大多数地图都包含一个经纬网格,这是一个带标注的纬线和经线的参考网络。Basemap 使用 drawparallels() 和 drawmeridians() 实例方法实现此功能。经线和纬线可以在与地图投影边界相交的地方进行标注。有少数例外:当 proj 设置为 ortho(正射投影)、geos(地球同步卫星投影)、vandg(范德格林滕投影)或 nsper(近侧透视投影)时,地图上无法标注经线和纬线;此外,当 proj 设置为 ortho(正射投影)、geos(地球同步卫星投影)、vandg(范德格林滕投影)、nsper(近侧透视投影)、moll(莫尔韦德投影)、hammer(哈默尔投影)或 sinu(正弦投影)时,无法标注经线。这是因为在这些地图上,线条在与边界相交的地方可能非常密集,因此实际上需要在图的内部手动标注它们。下面是一个示例,展示了如何绘制纬线和经线并在图的不同侧面进行标注。
from mpl_toolkits.basemap import Basemap
import matplotlib.pyplot as plt
import numpy as np
# setup Lambert Conformal basemap.
m = Basemap(width=12000000,height=9000000,projection='lcc',
            resolution='c',lat_1=45.,lat_2=55,lat_0=50,lon_0=-107.)
# draw coastlines.
m.drawcoastlines()
# draw a boundary around the map, fill the background.
# this background will end up being the ocean color, since
# the continents will be drawn on top.
m.drawmapboundary(fill_color='aqua')
# fill continents, set lake color same as ocean color.
m.fillcontinents(color='coral',lake_color='aqua')
# draw parallels and meridians.
# label parallels on right and top
# meridians on bottom and left
parallels = np.arange(0.,81,10.)
# labels = [left,right,top,bottom]
m.drawparallels(parallels,labels=[False,True,True,False])
meridians = np.arange(10.,351.,20.)
m.drawmeridians(meridians,labels=[True,False,False,True])
plt.show()
(源代码)